CAGNY is The Coca-Cola Company's flagship investor conference, and this deck had one job: set the CEO and CFO up to walk into that room with total confidence. Over three to four months of daily internal and client meetings, our team worked around the clock with a freelancer in Australia to keep pace with constant updates, building an icon system and running a photoshoot to bring the company's beverage portfolio to life visually. The real work wasn't just design; it was translation. The client held the data and knew exactly what it meant; our job was asking what that data was really trying to say, then finding the north star that made a room full of investors understand it at a glance.
Building the Deck That Sets Up the C-Suite
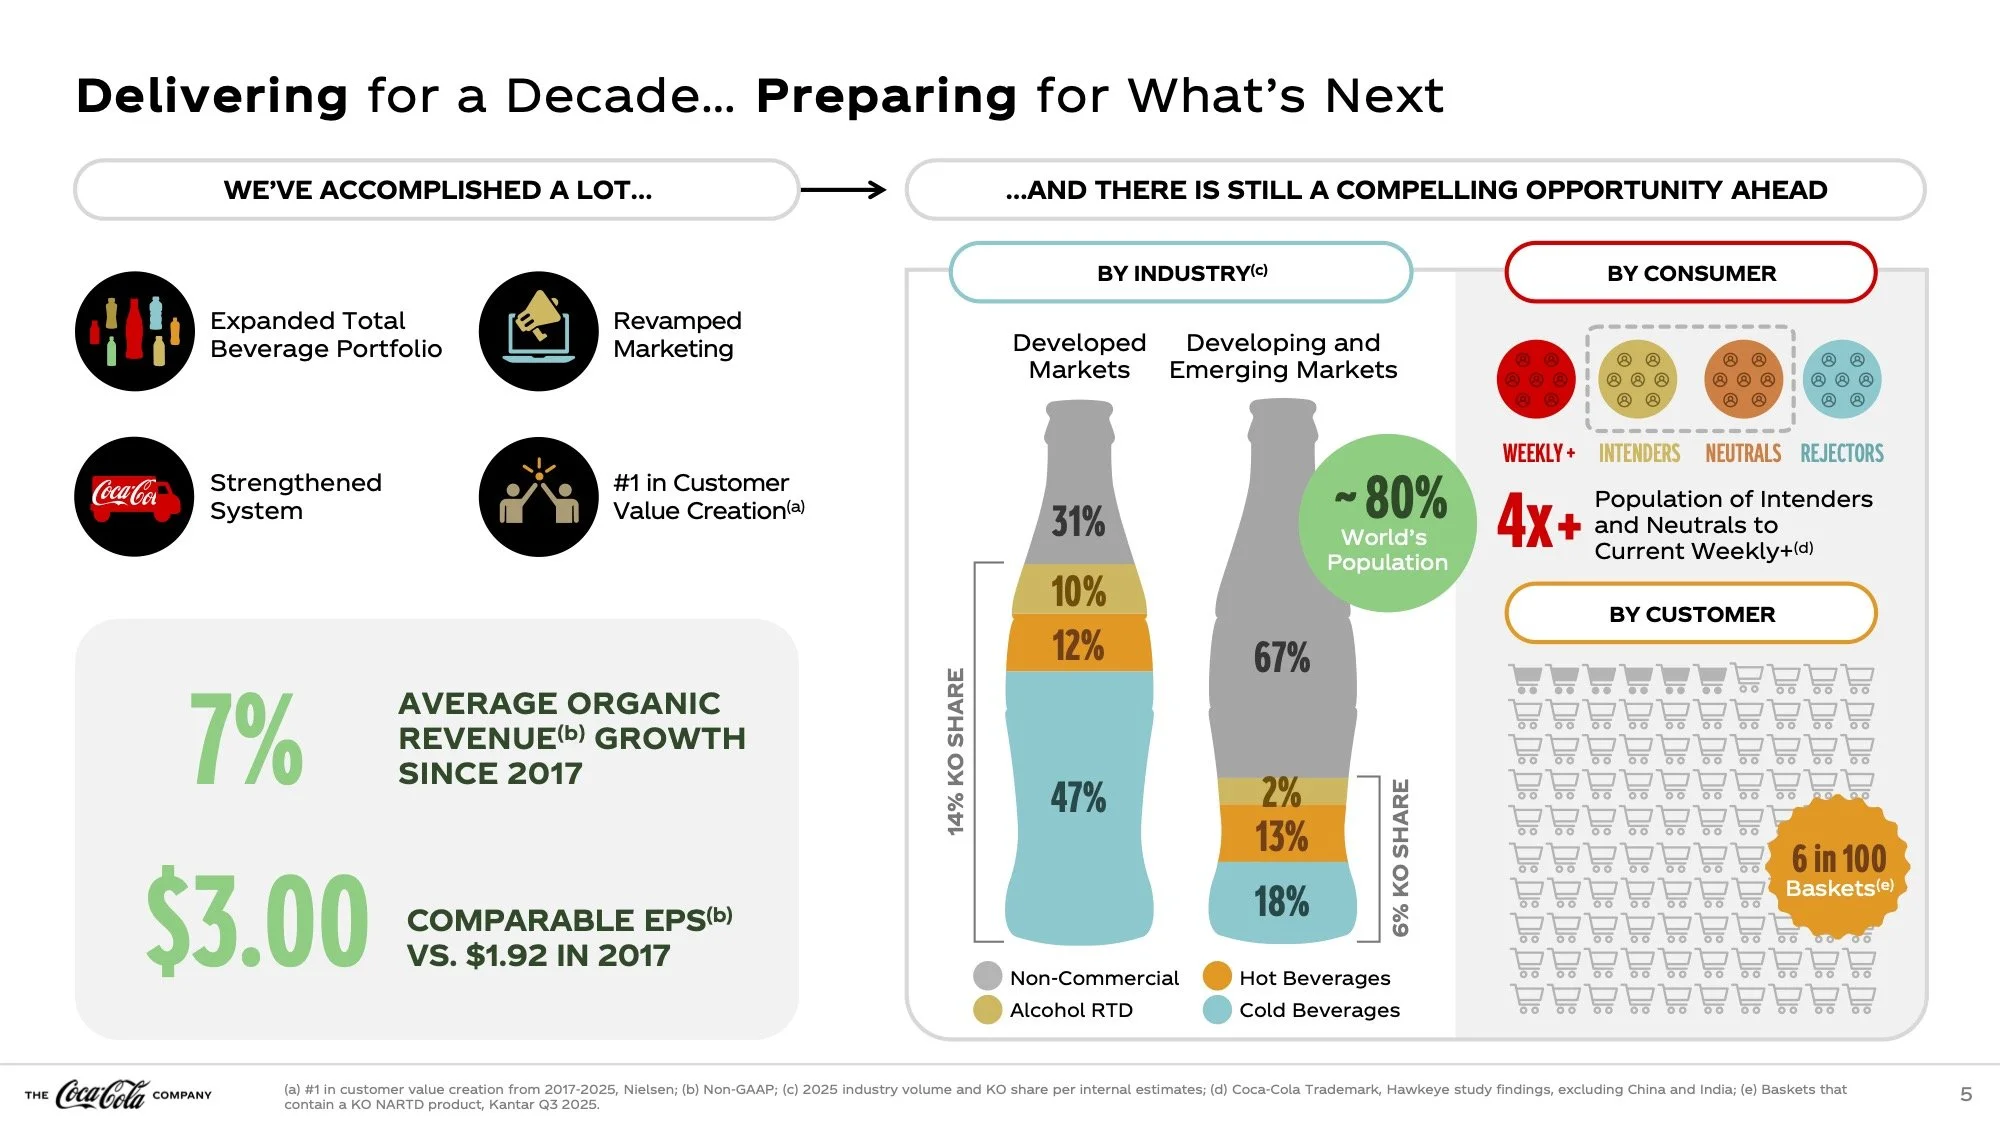
Bottle-shaped infographics turned market share data into something worth looking twice at.
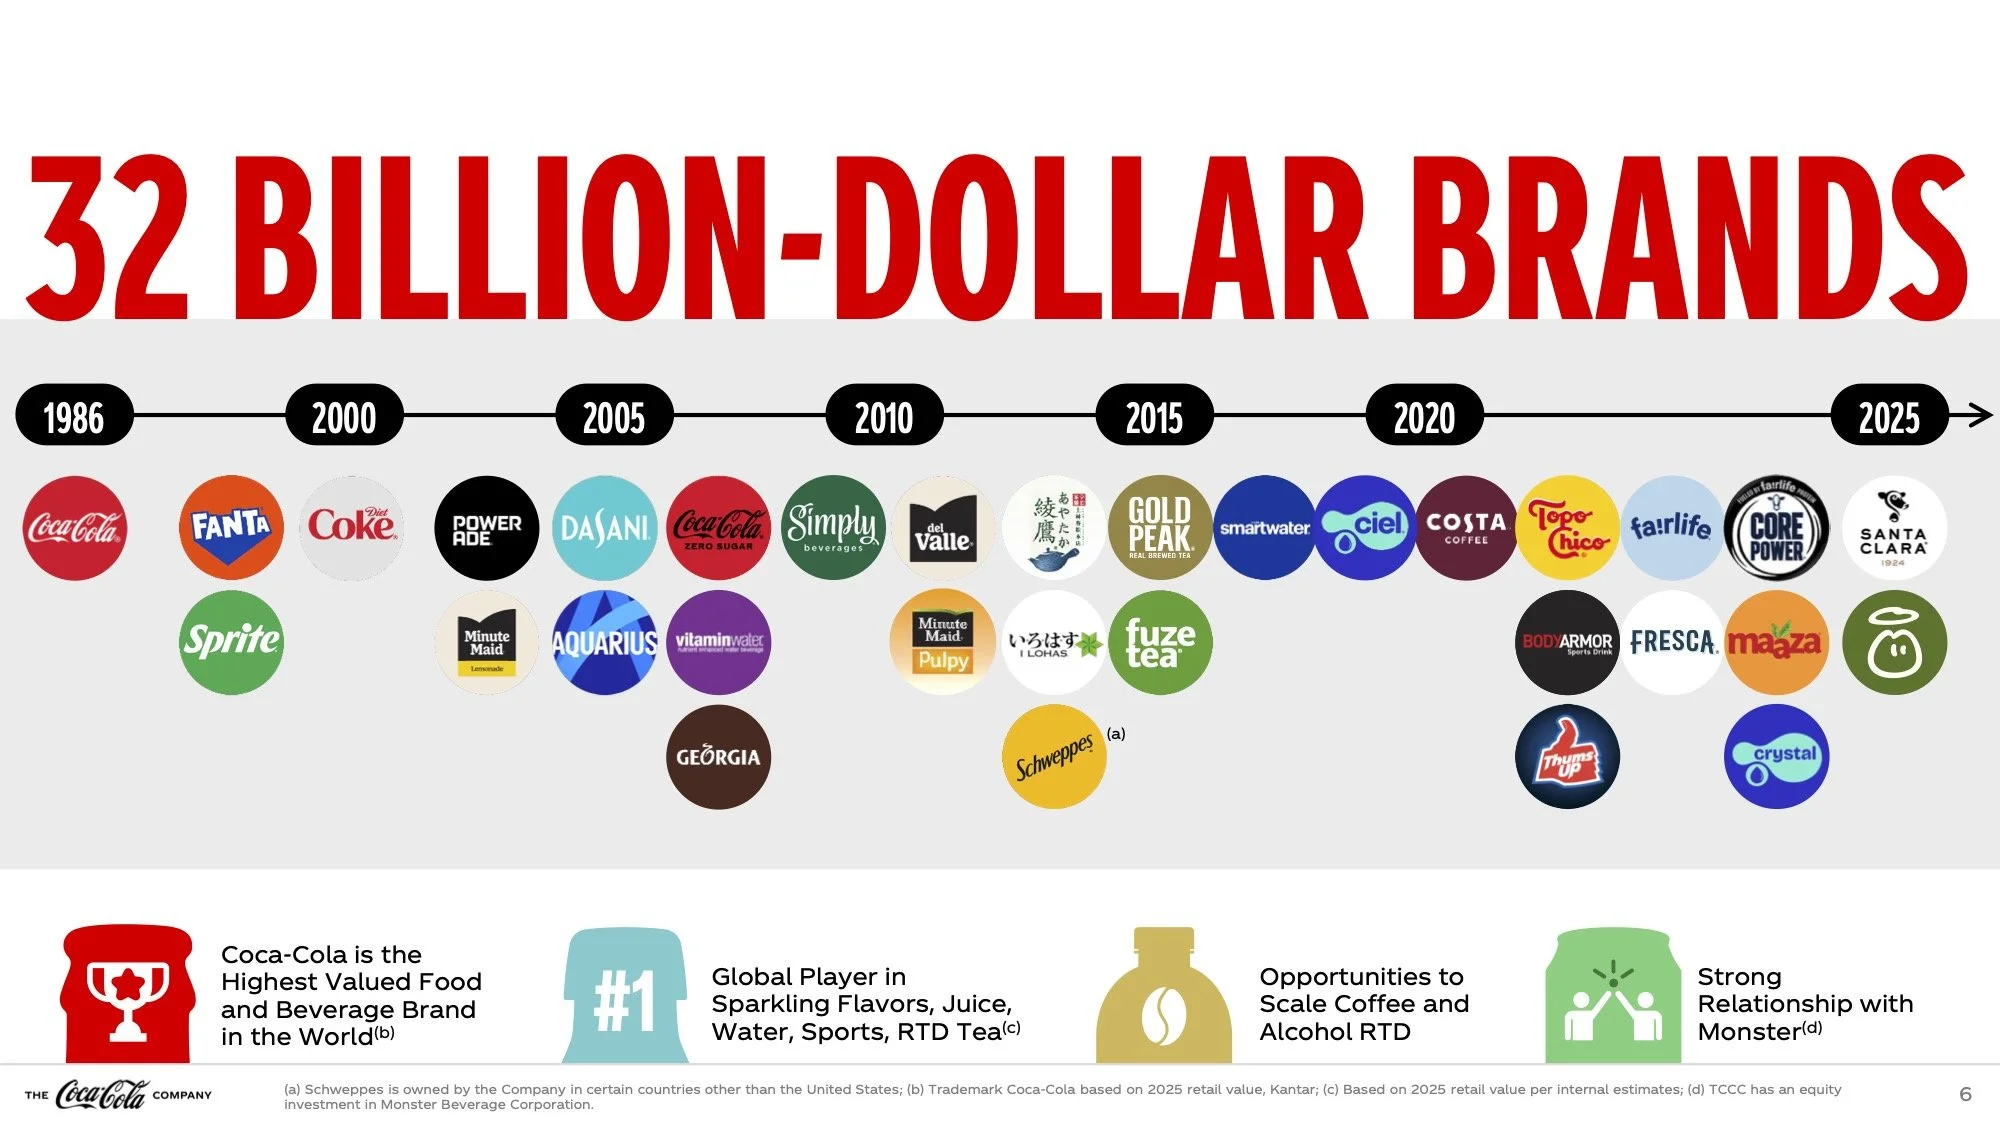
A twenty five year timeline of brand logos, showing scale in a way no bar chart could match.
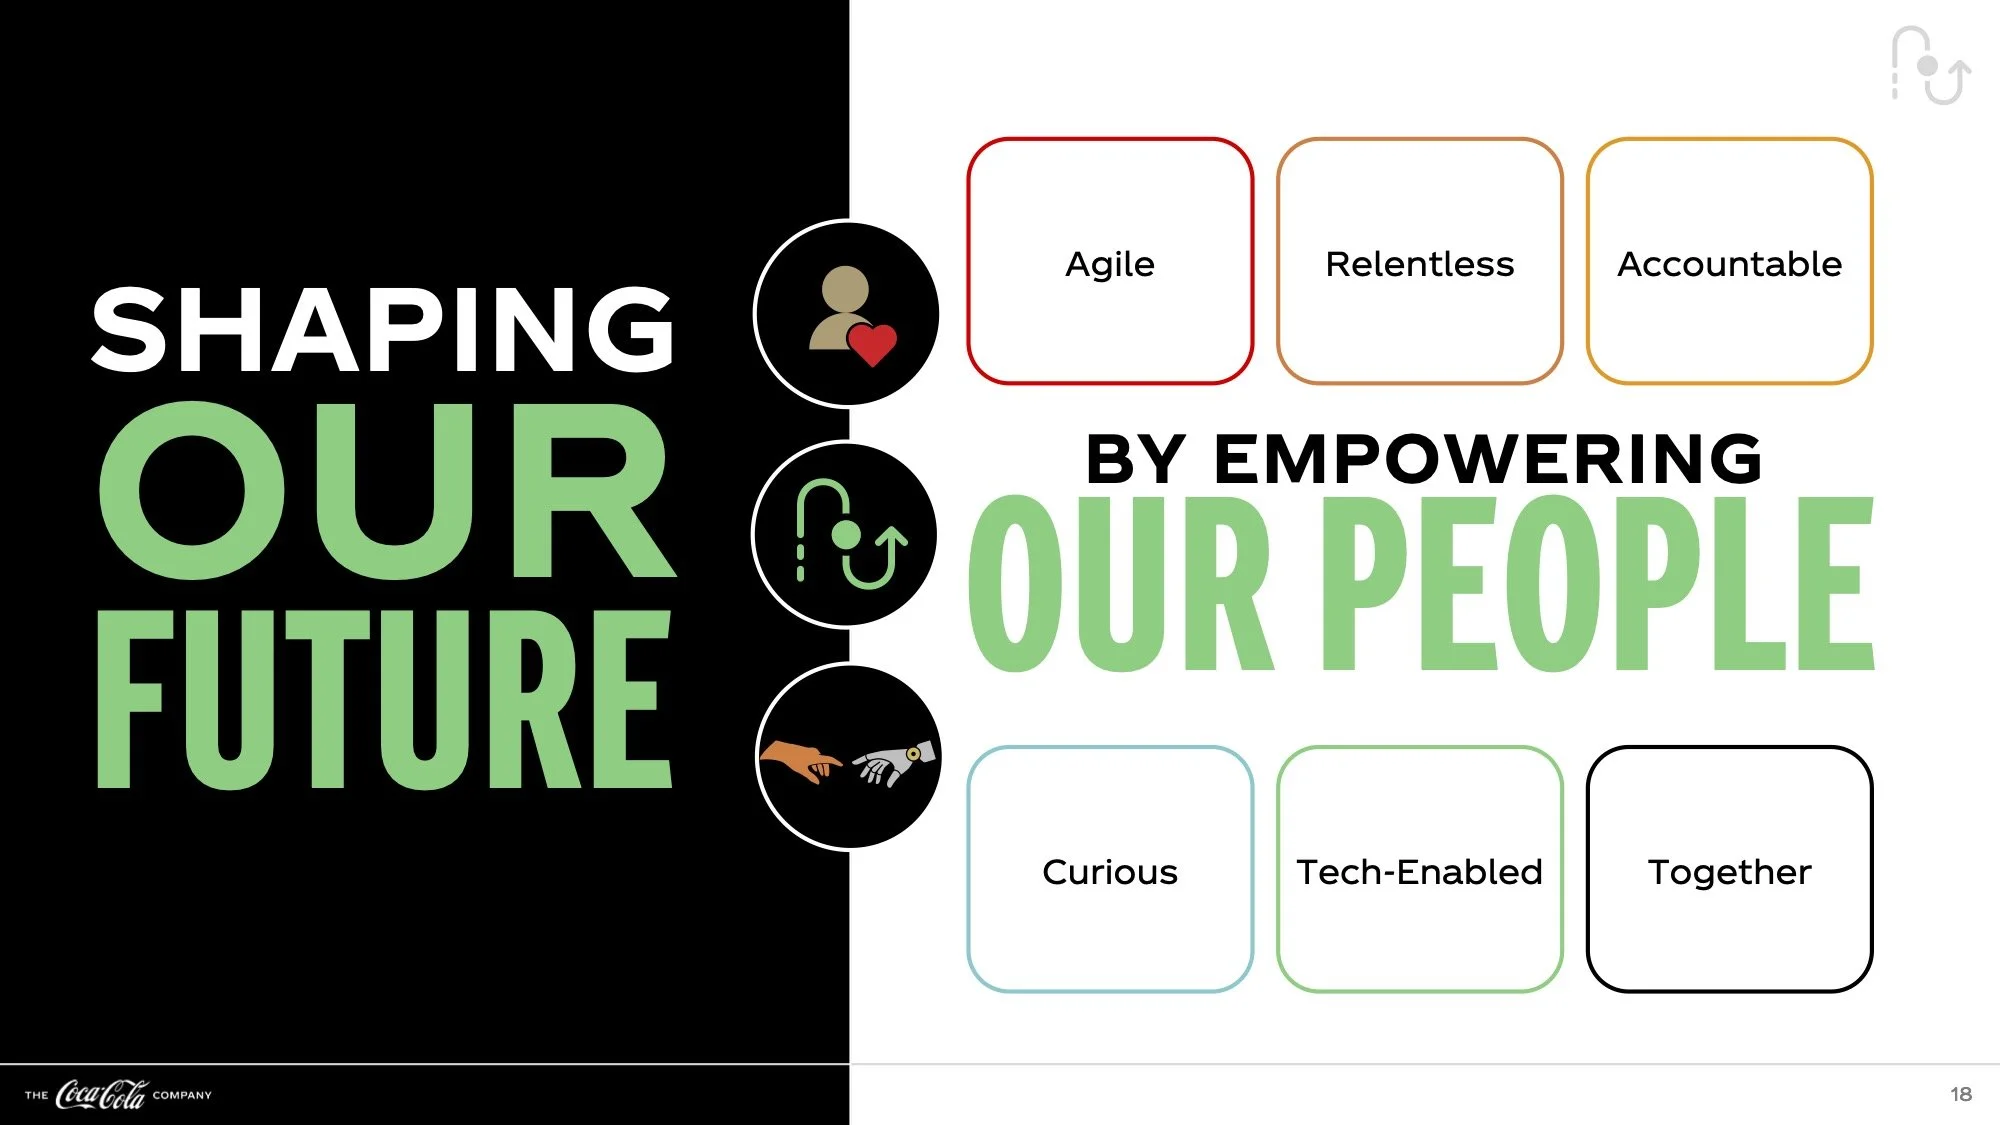
Split black and white treatment gave equal visual weight to culture and strategy on the same slide.
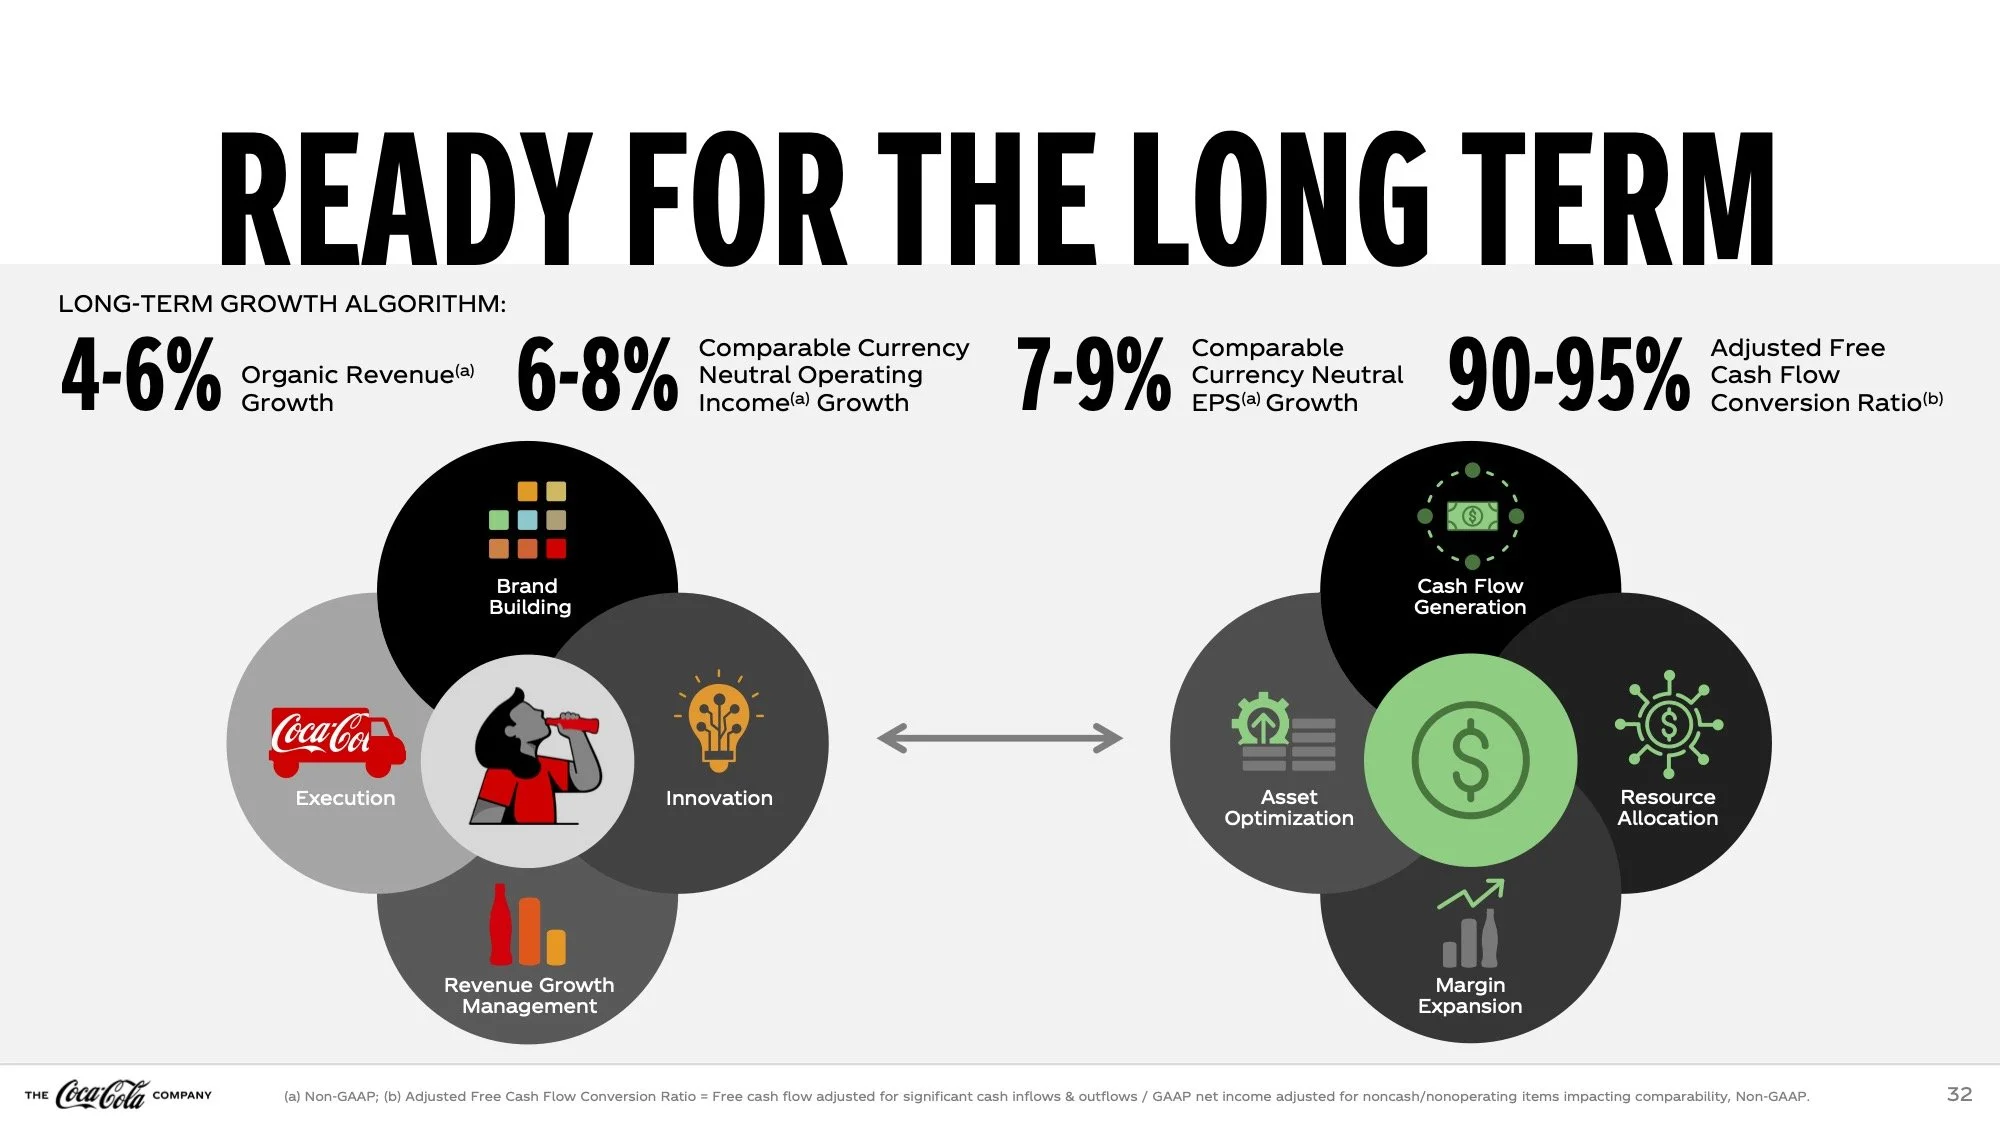
Two mirrored icon clusters made a dense growth algorithm feel balanced and intentional instead of overwhelming.
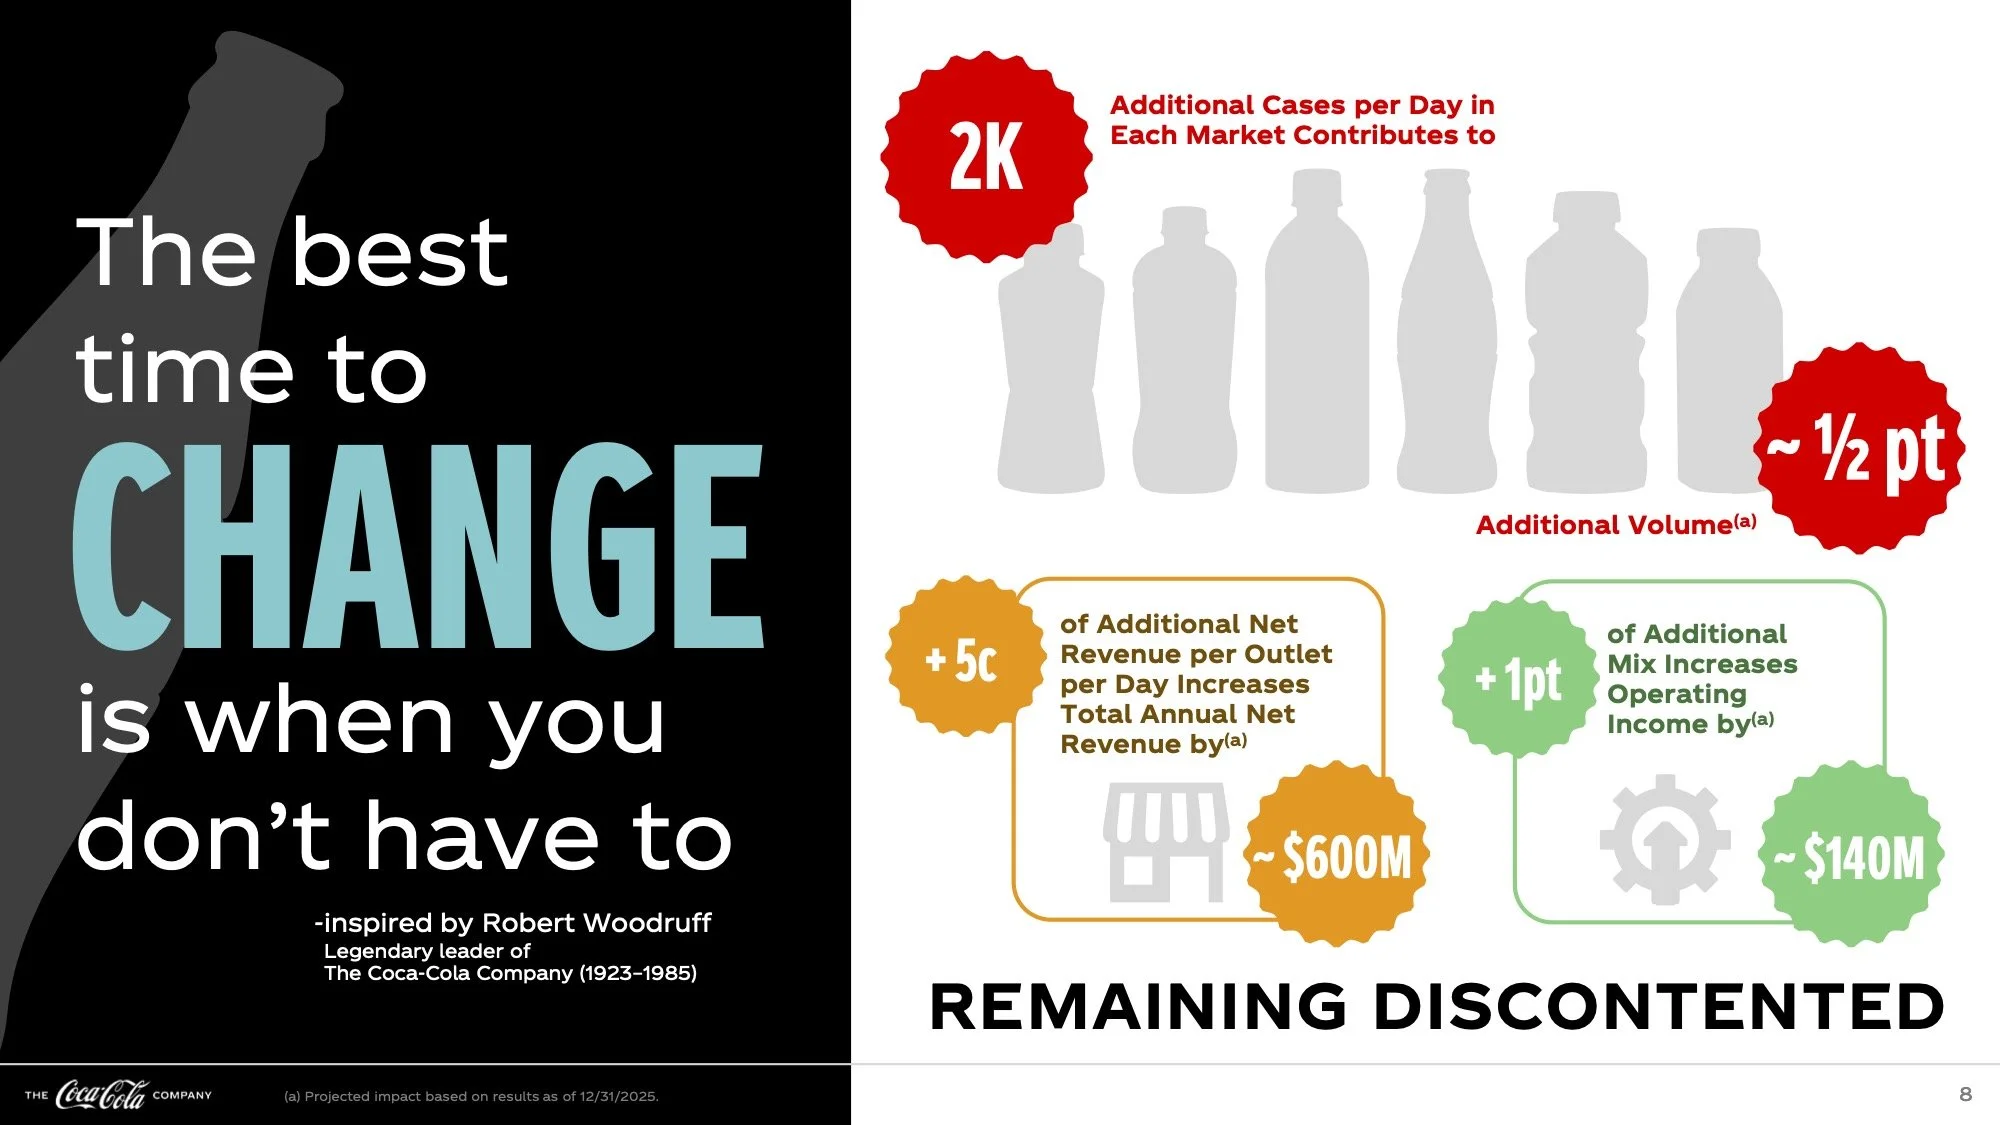
A Woodruff quote paired with hard numbers, proving legacy and performance can share a slide.
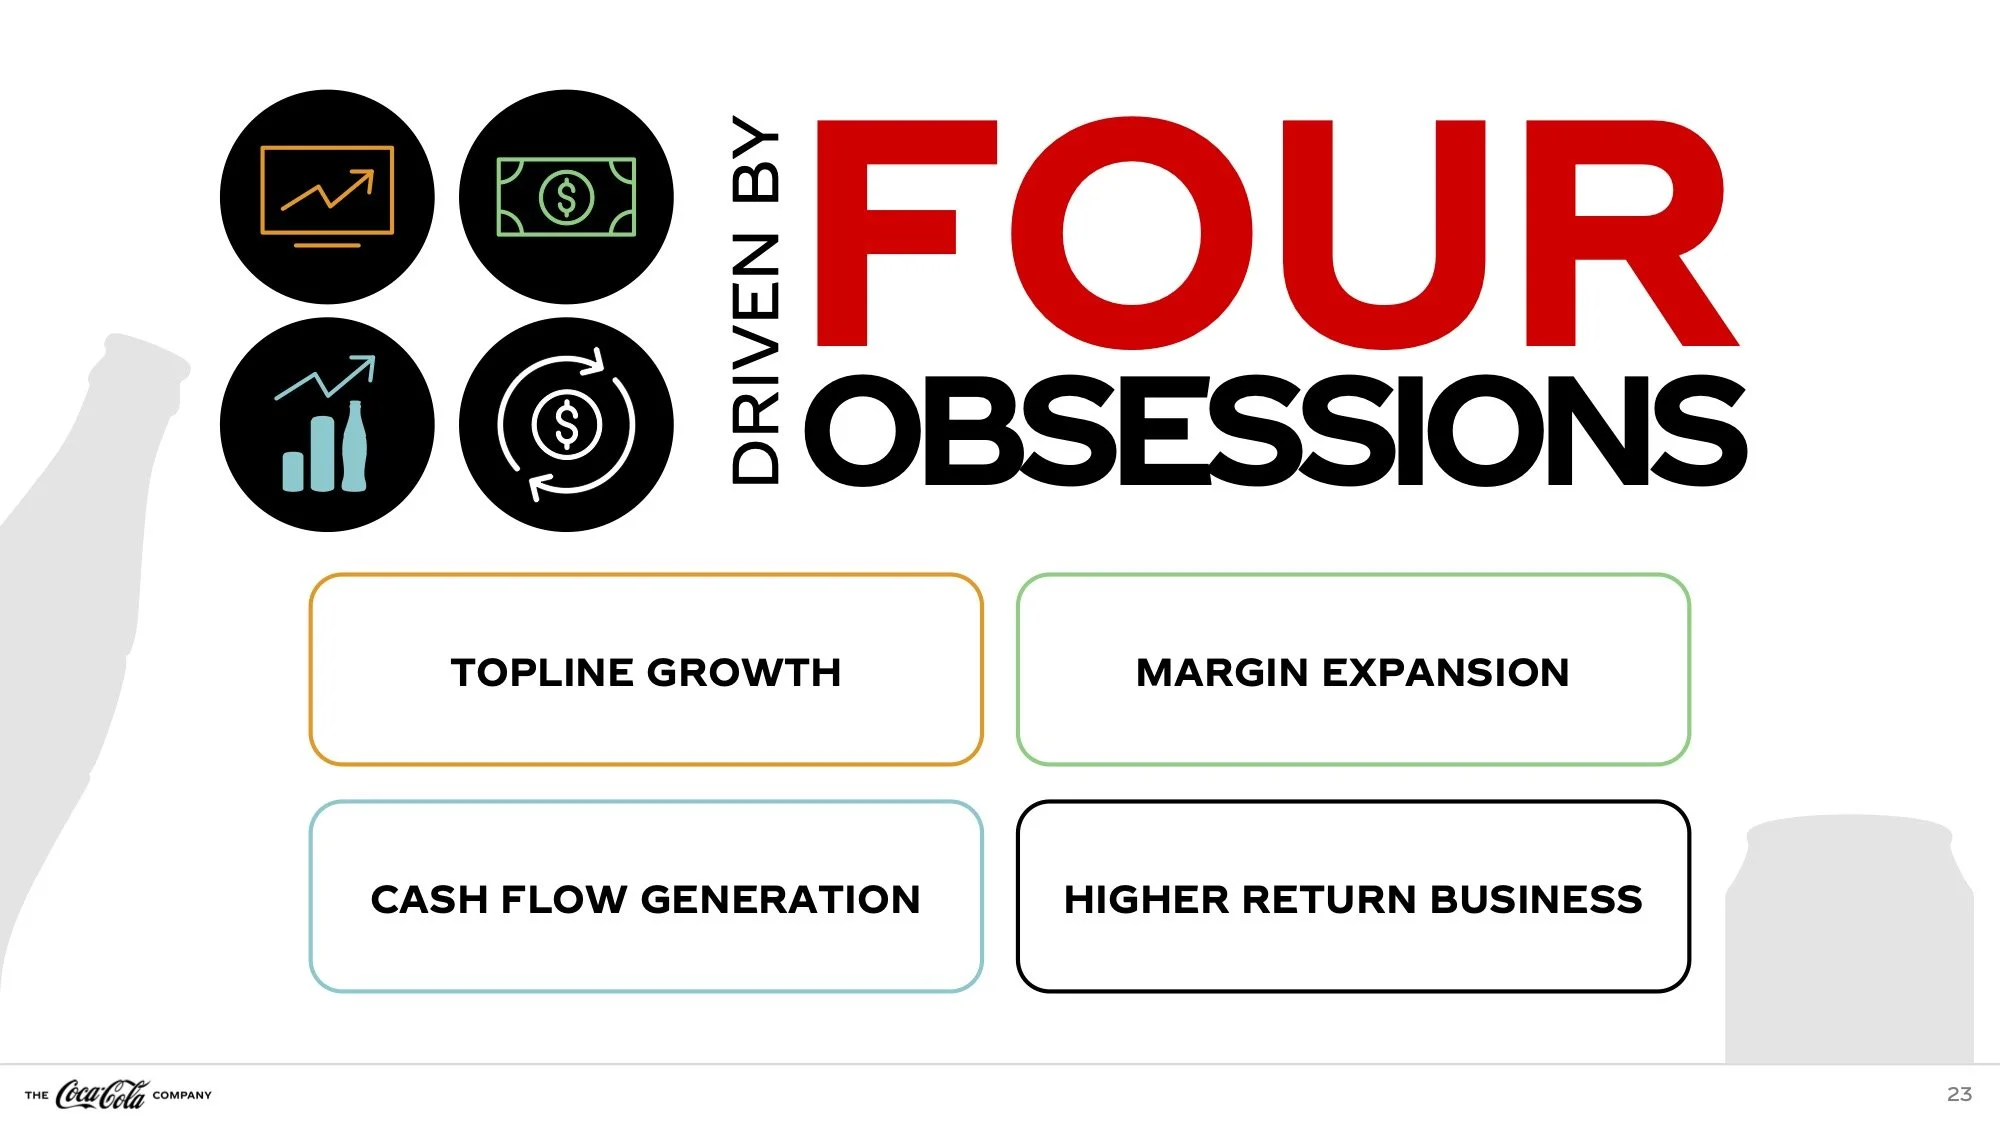
A custom icon system built to make the company's financial priorities instantly scannable, not just readable.
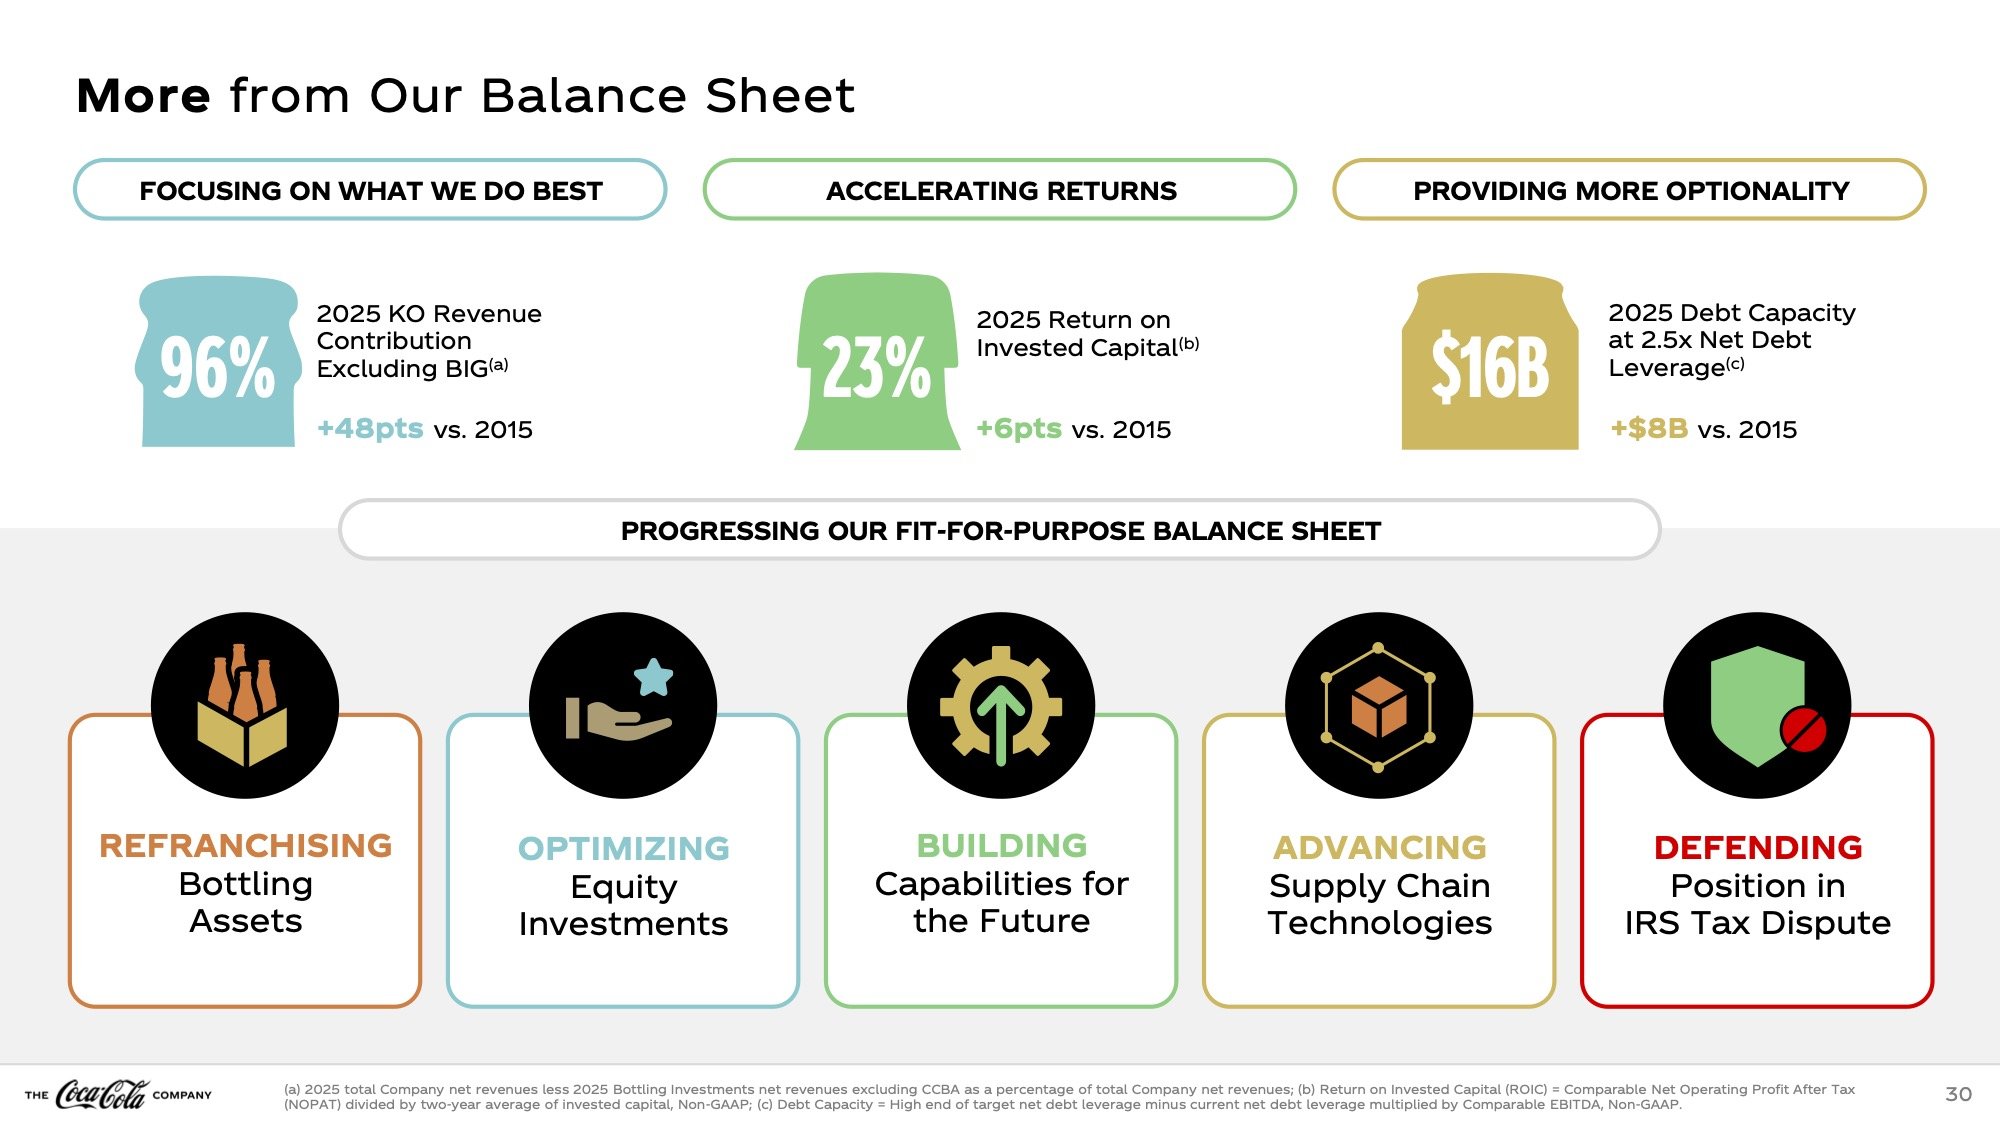
A five-icon system turned financial strategy into a clear, scannable story in seconds.
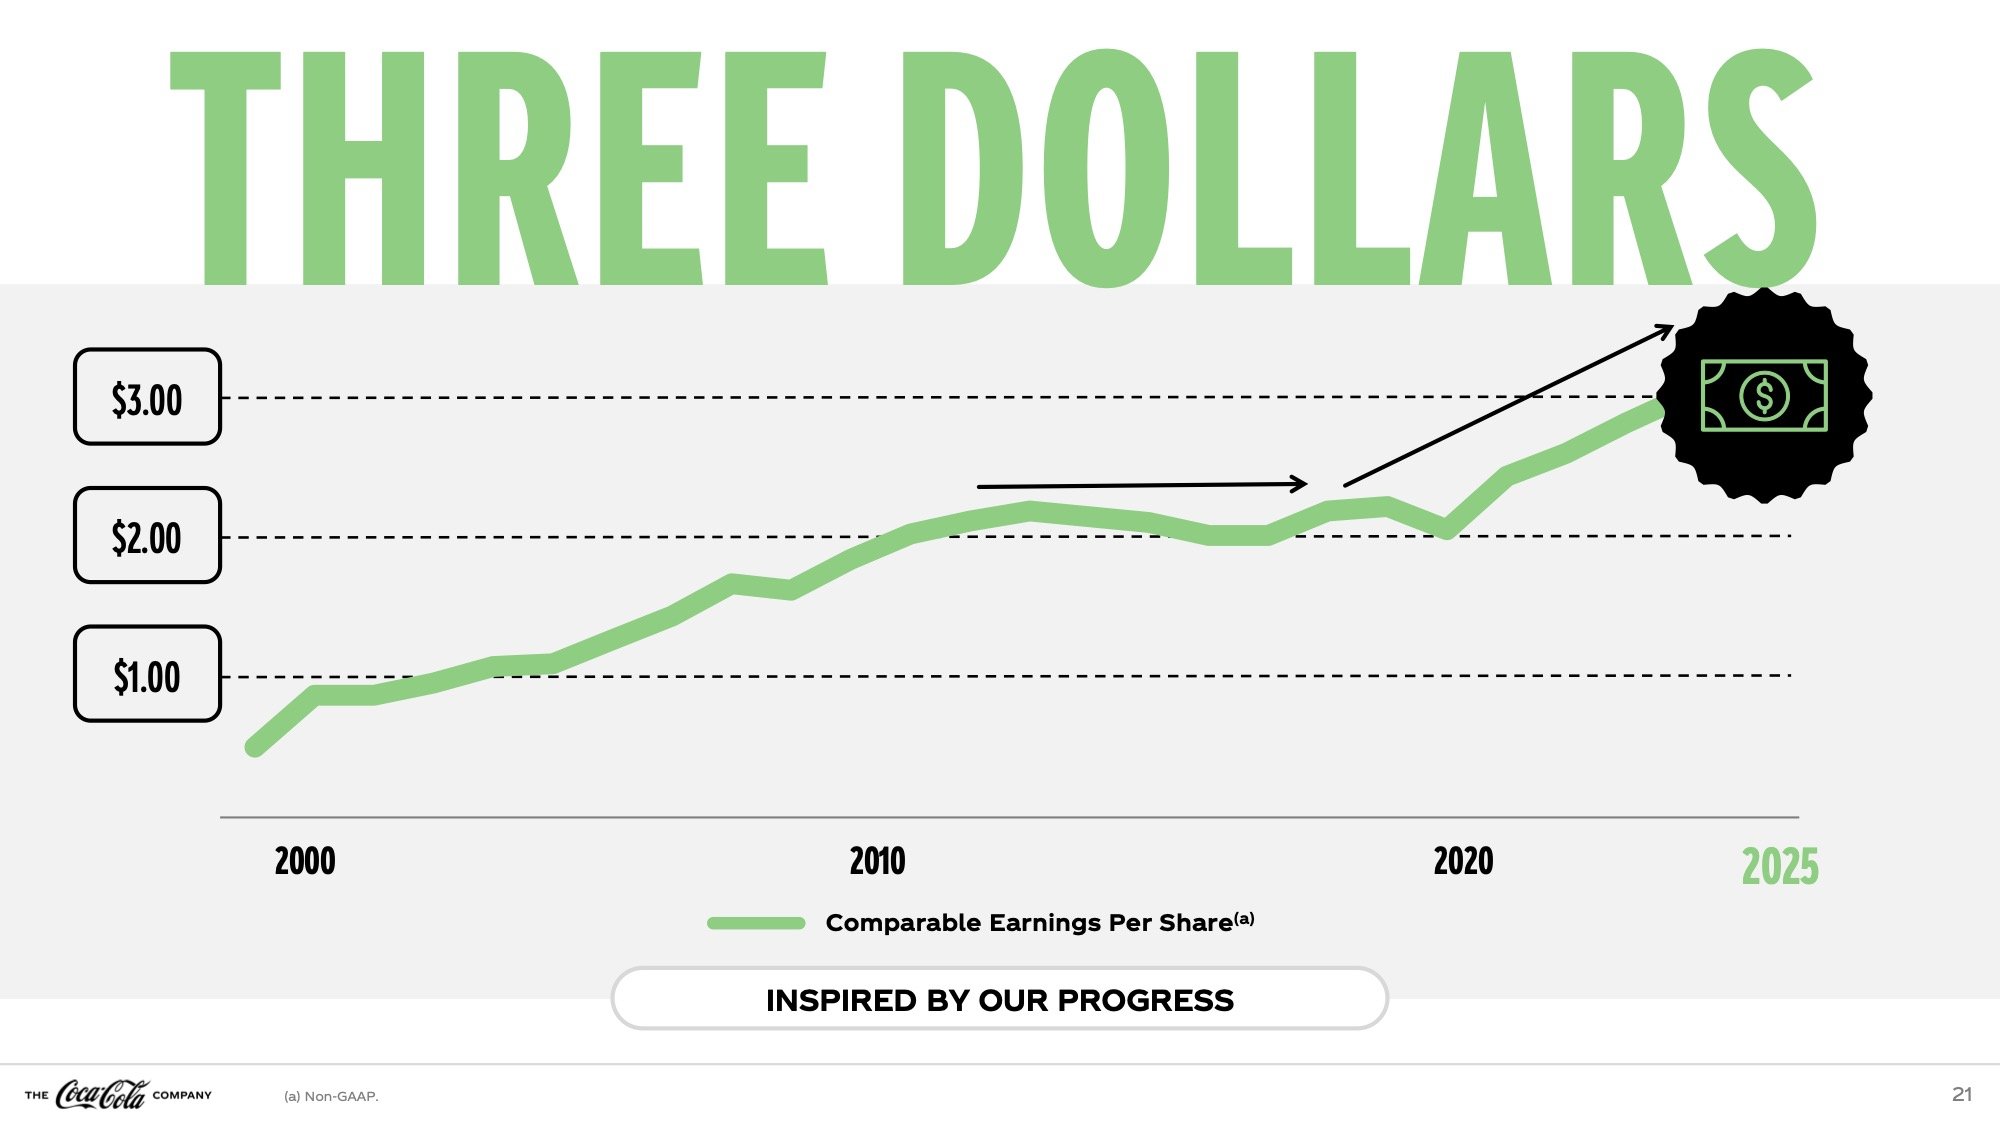
Twenty-five years of earnings per share growth told as a single upward line, with the icon system marking the finish.
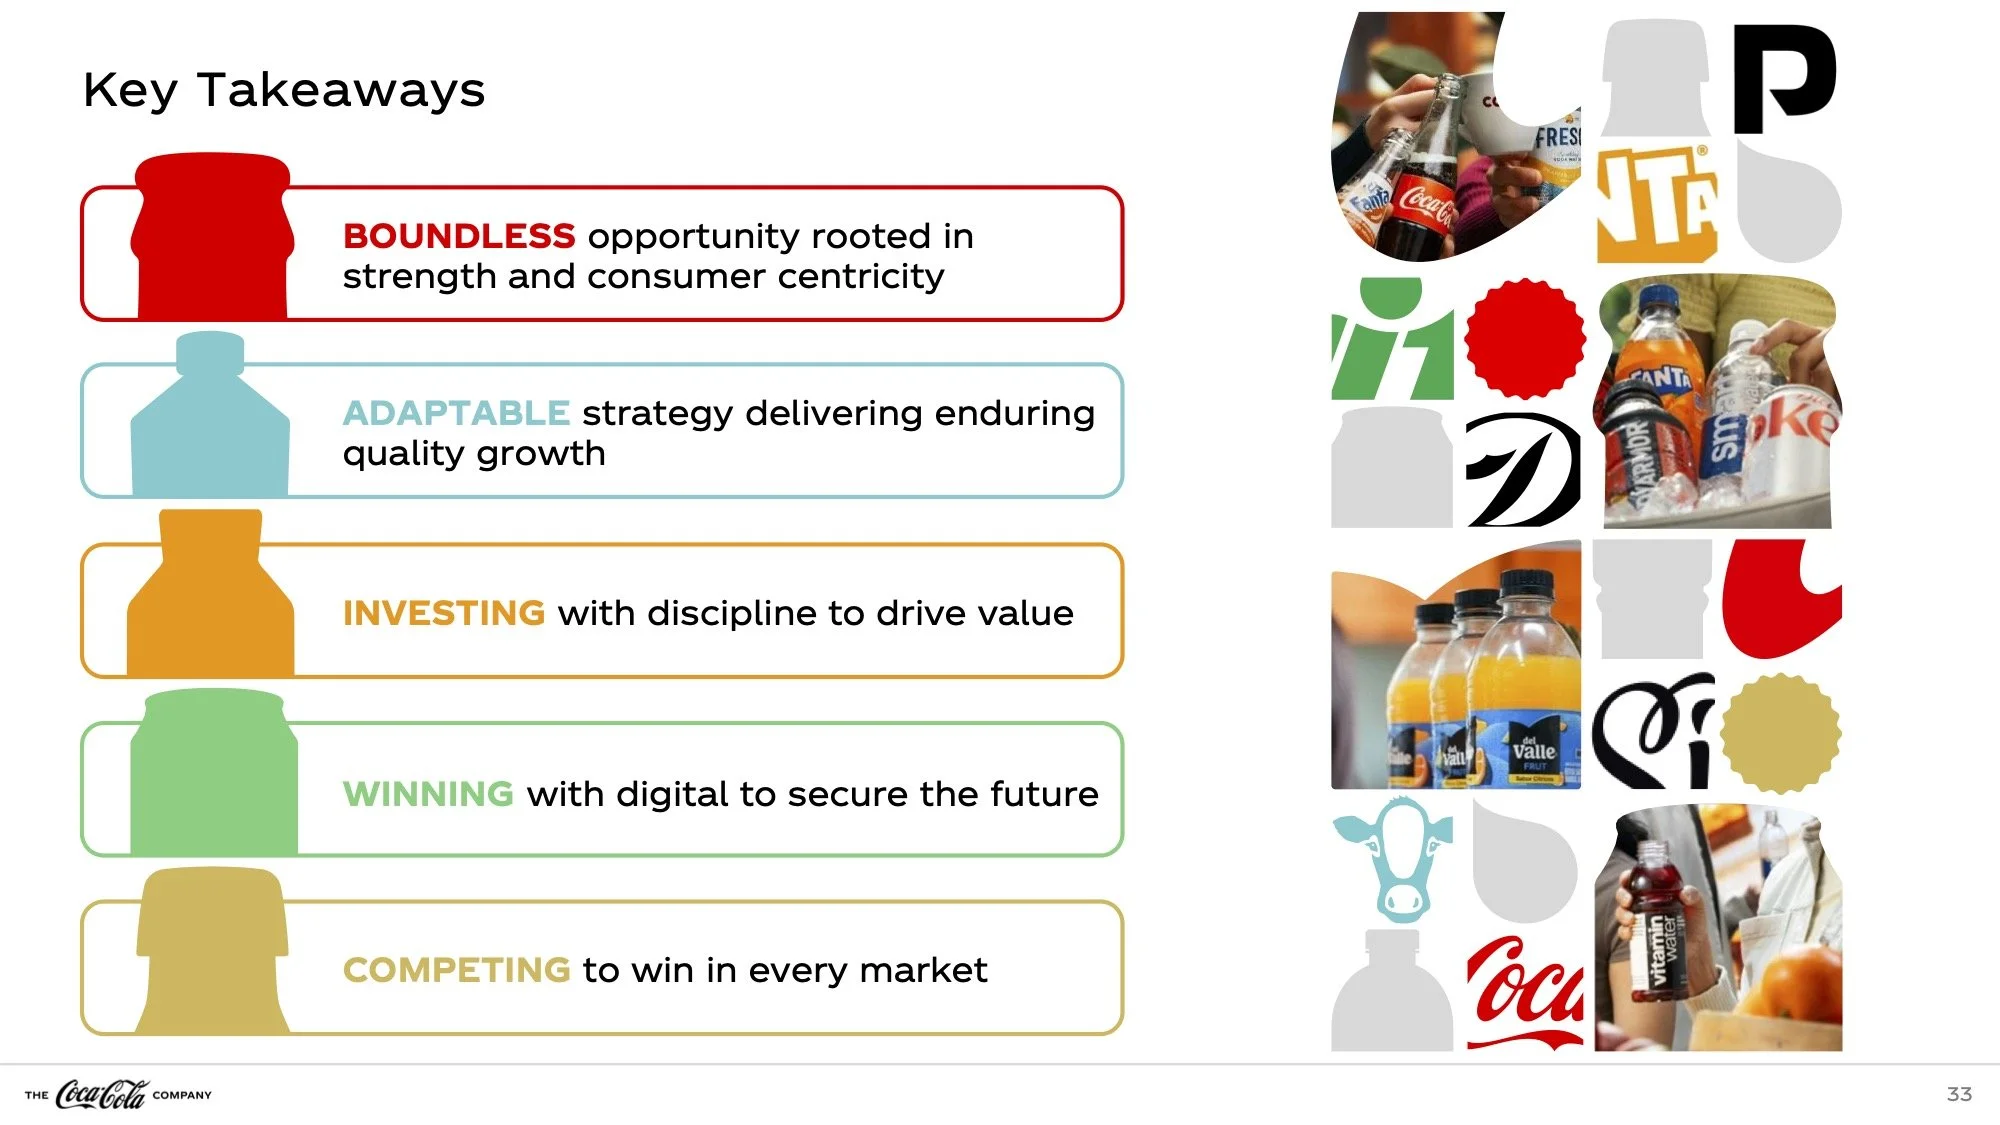
Five pillars closing the deck, each paired with real product and brand photography from the shoot.
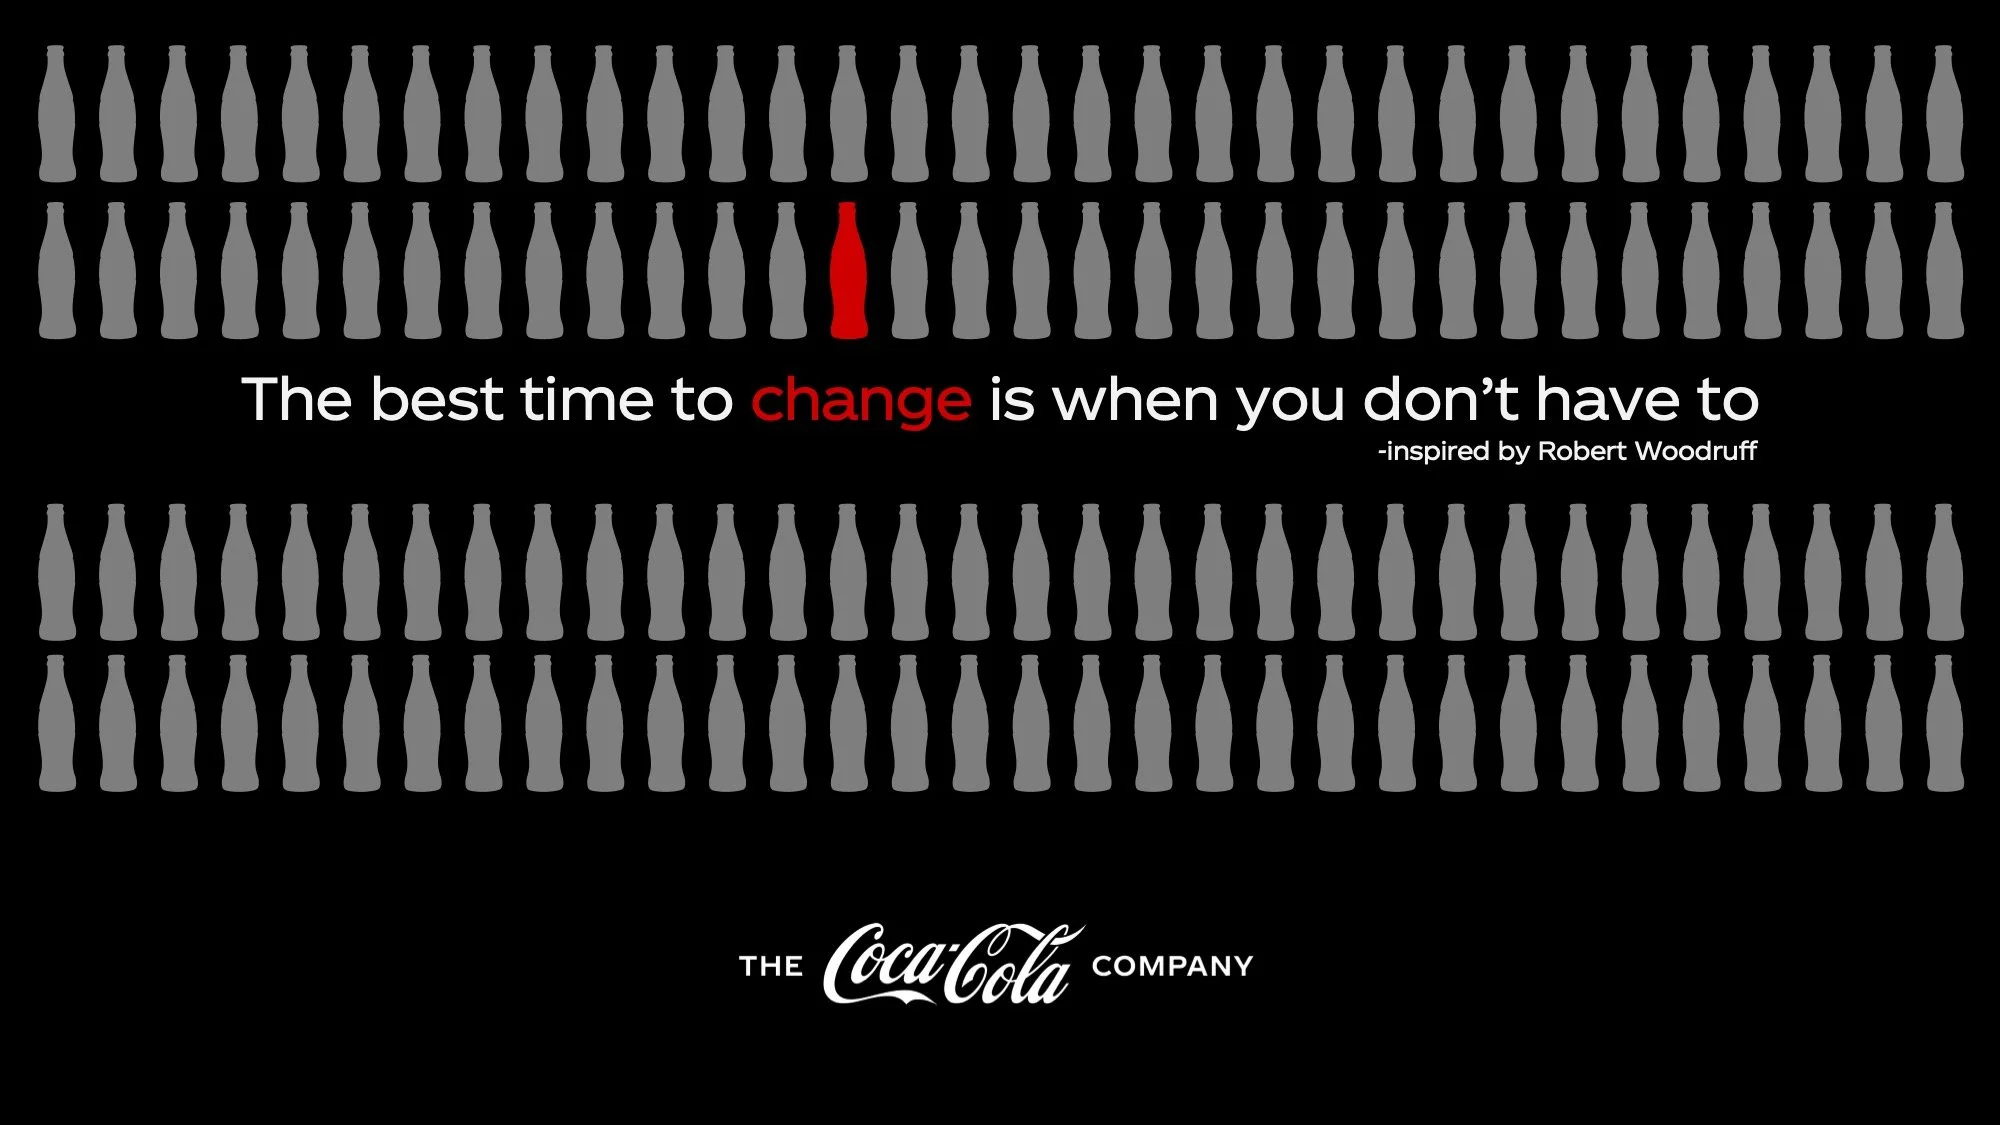
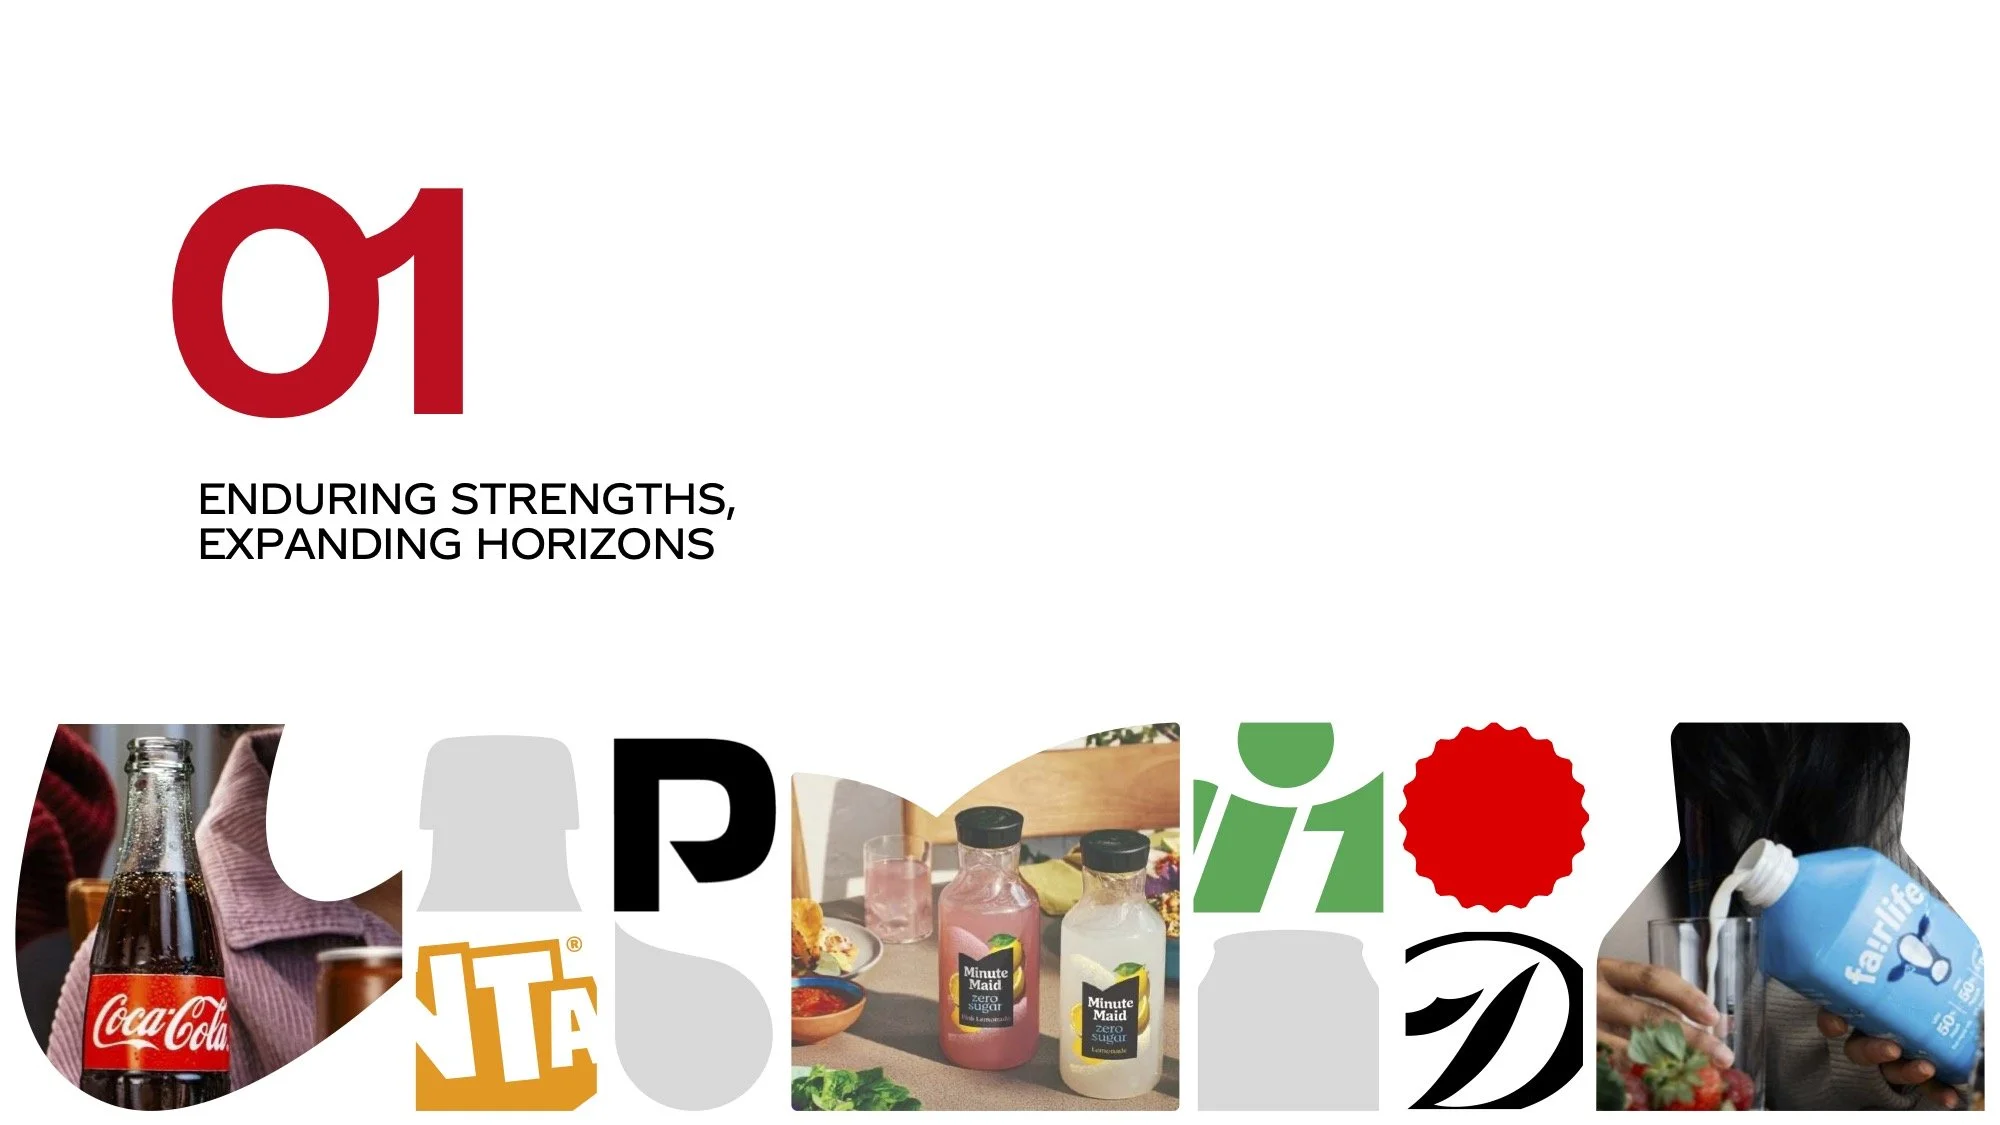
One red bottle in a sea of gray, this became one of the deck's most repeated visual devices.
Making a Report Worth Watching
The Business, Environmental, Social, and Governance Report holds a year of data across seven pillars: people, agriculture, climate, water, packaging, total beverage portfolio, and partnerships. That much information rarely gets read, let alone watched. As lead designer and illustrator, a visual system was designed behind the campaign, giving each pillar its own color and icon so a year's worth of reporting became something an audience could actually follow. The series launched with a video featuring the Director of Sustainability walking through the report's biggest highlights, followed by a dedicated video for each pillar, both internally and externally, all leading back to the full report for anyone who wanted to go deeper.
Launch Campaign Asset
Water and Agriculture Social Assets
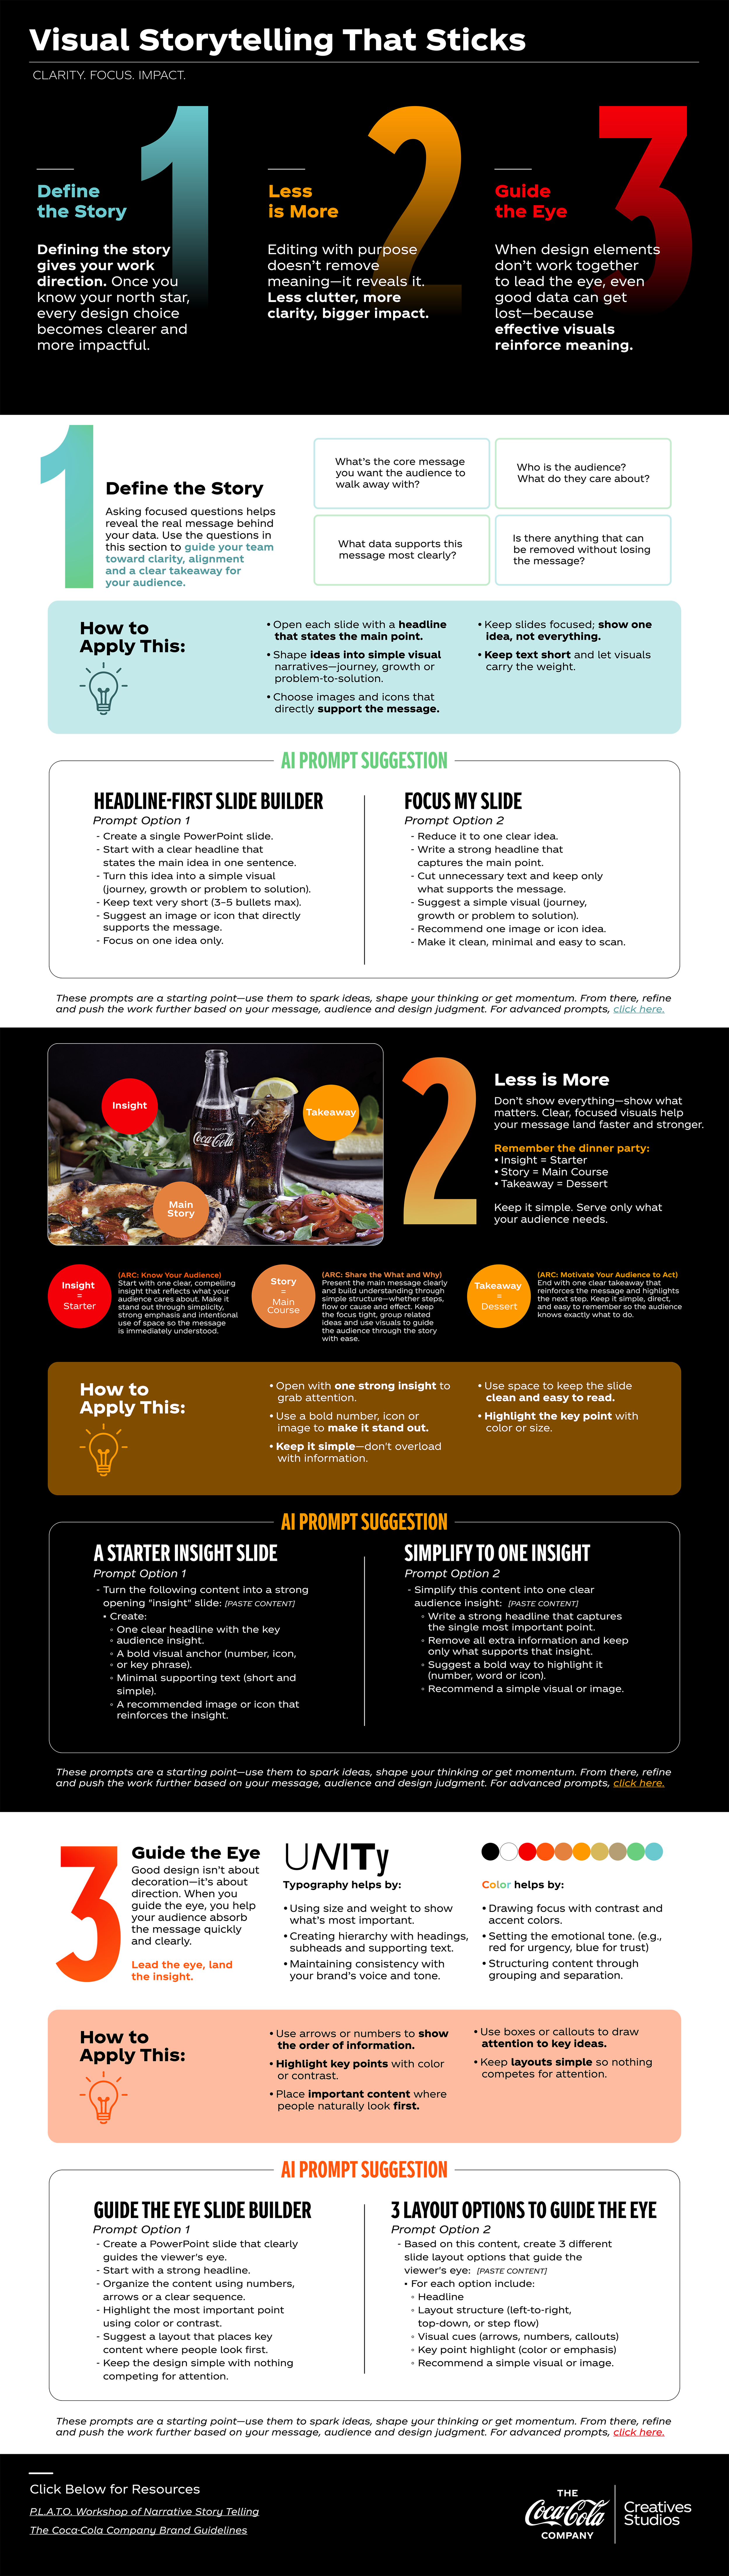
Visual Storytelling That Sticks
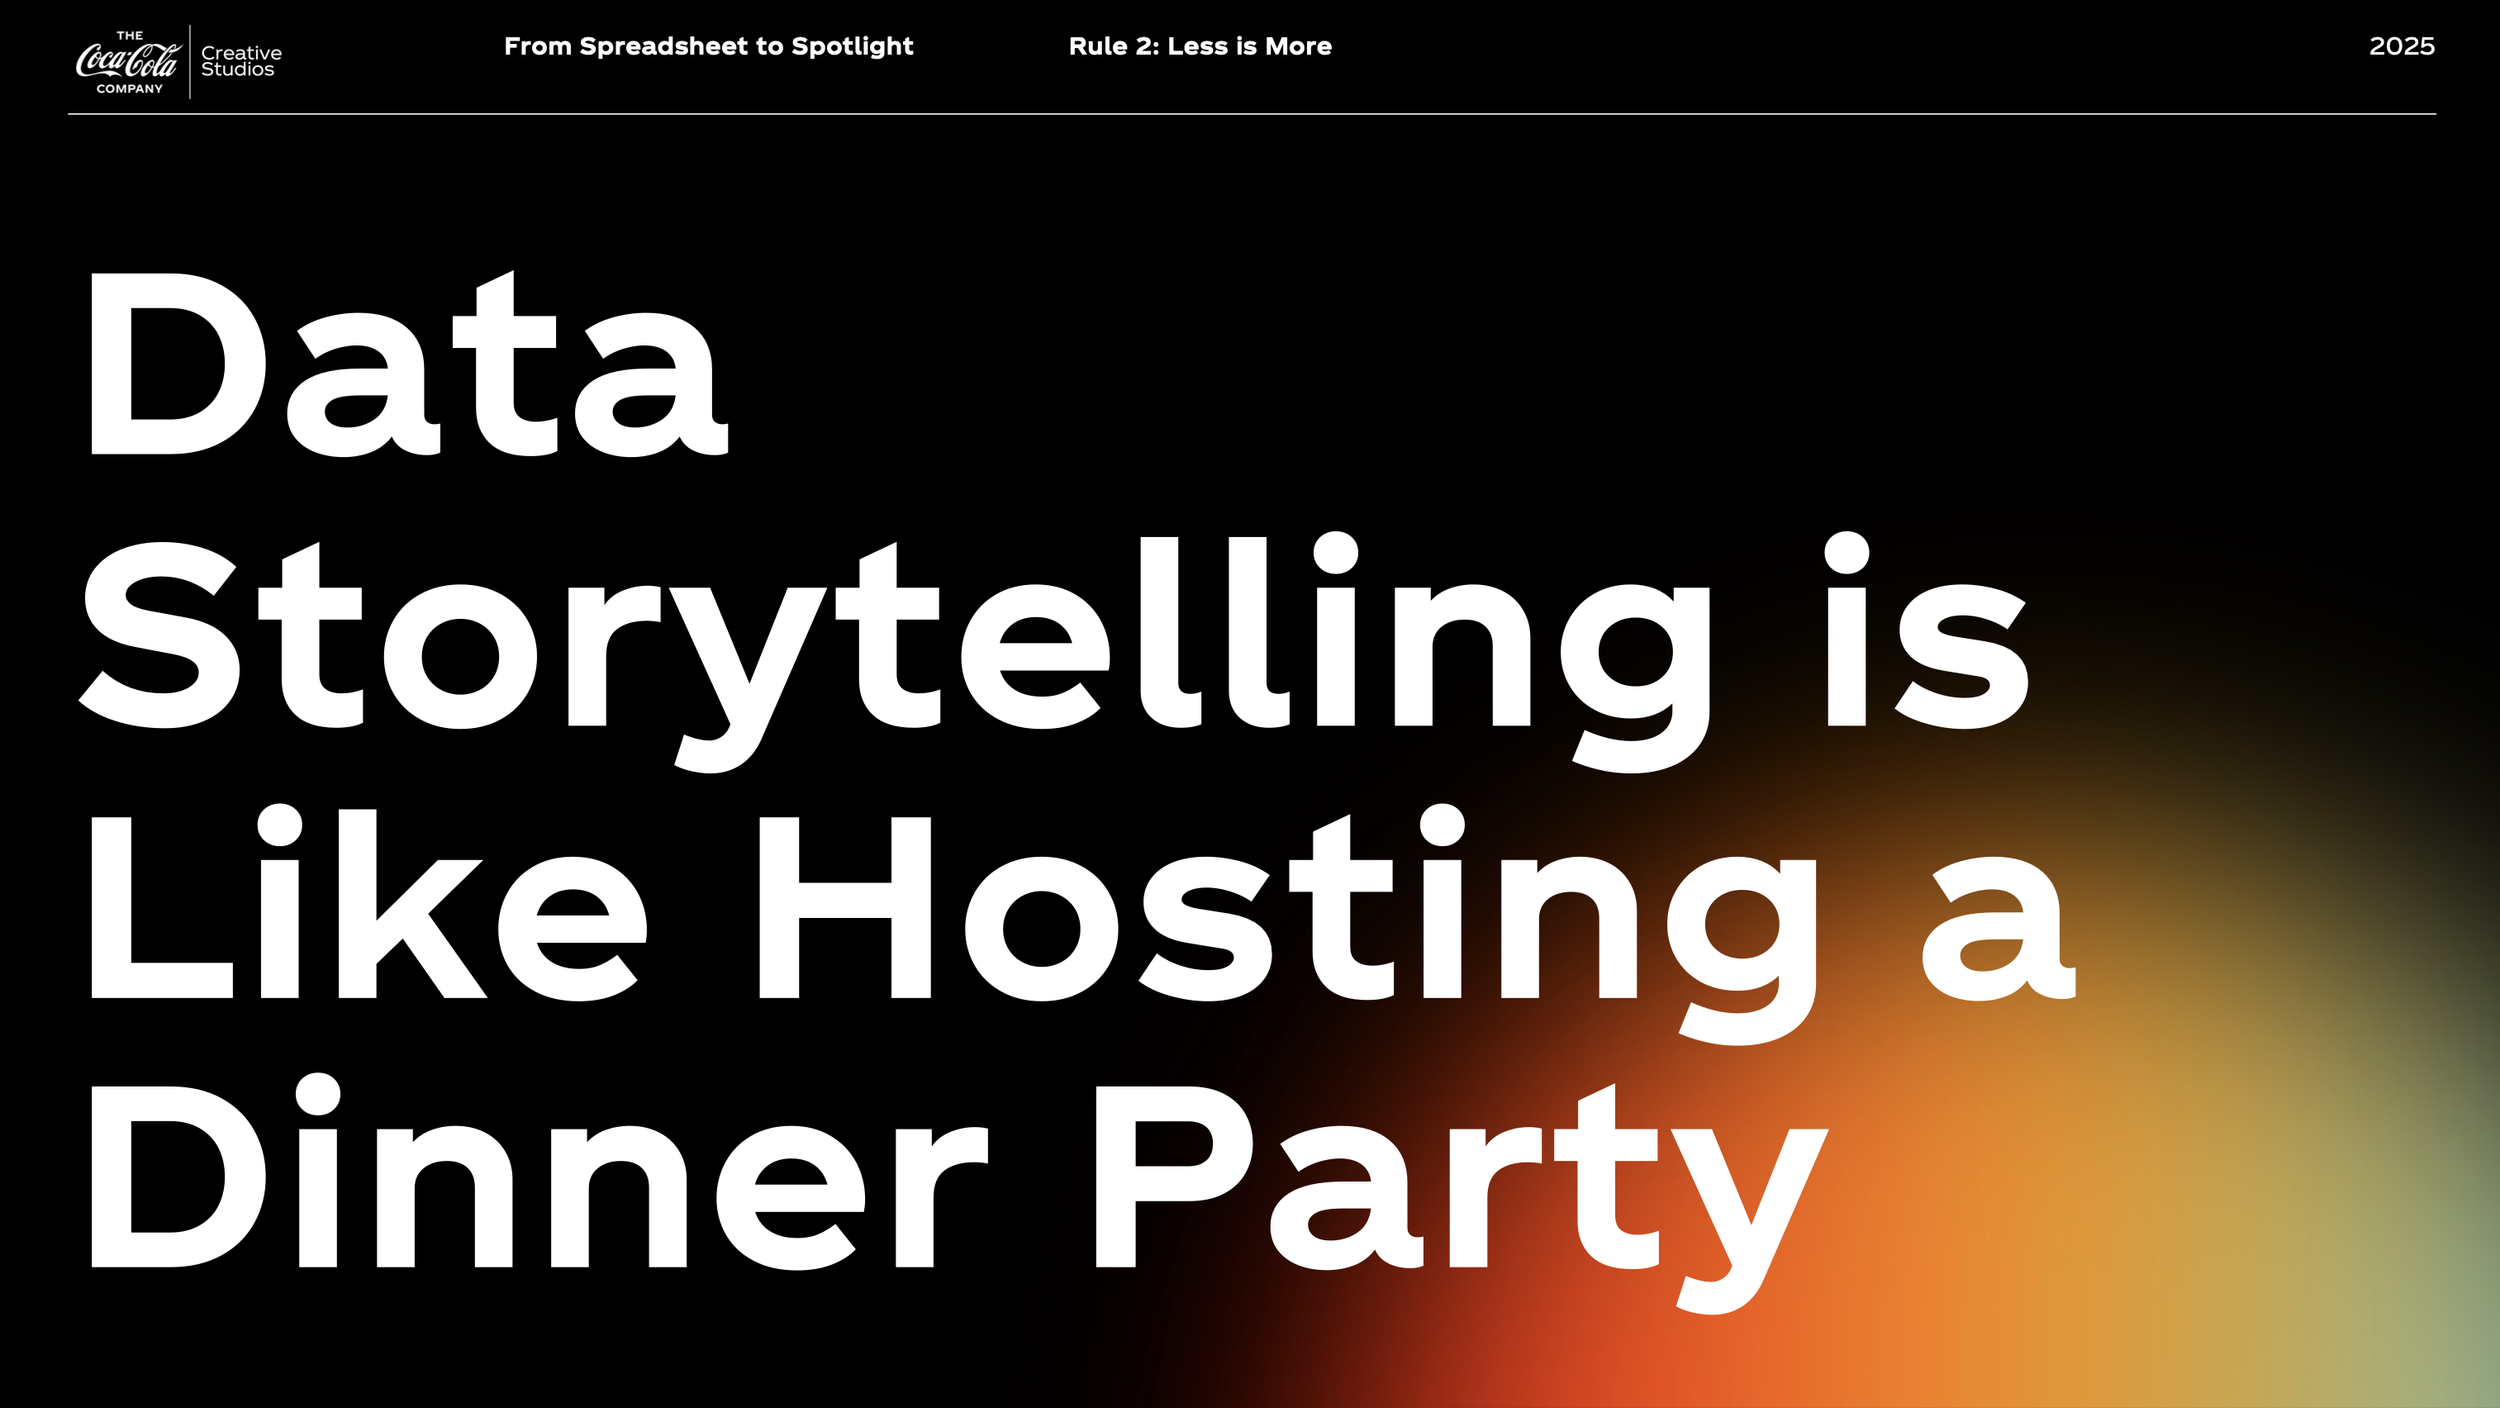
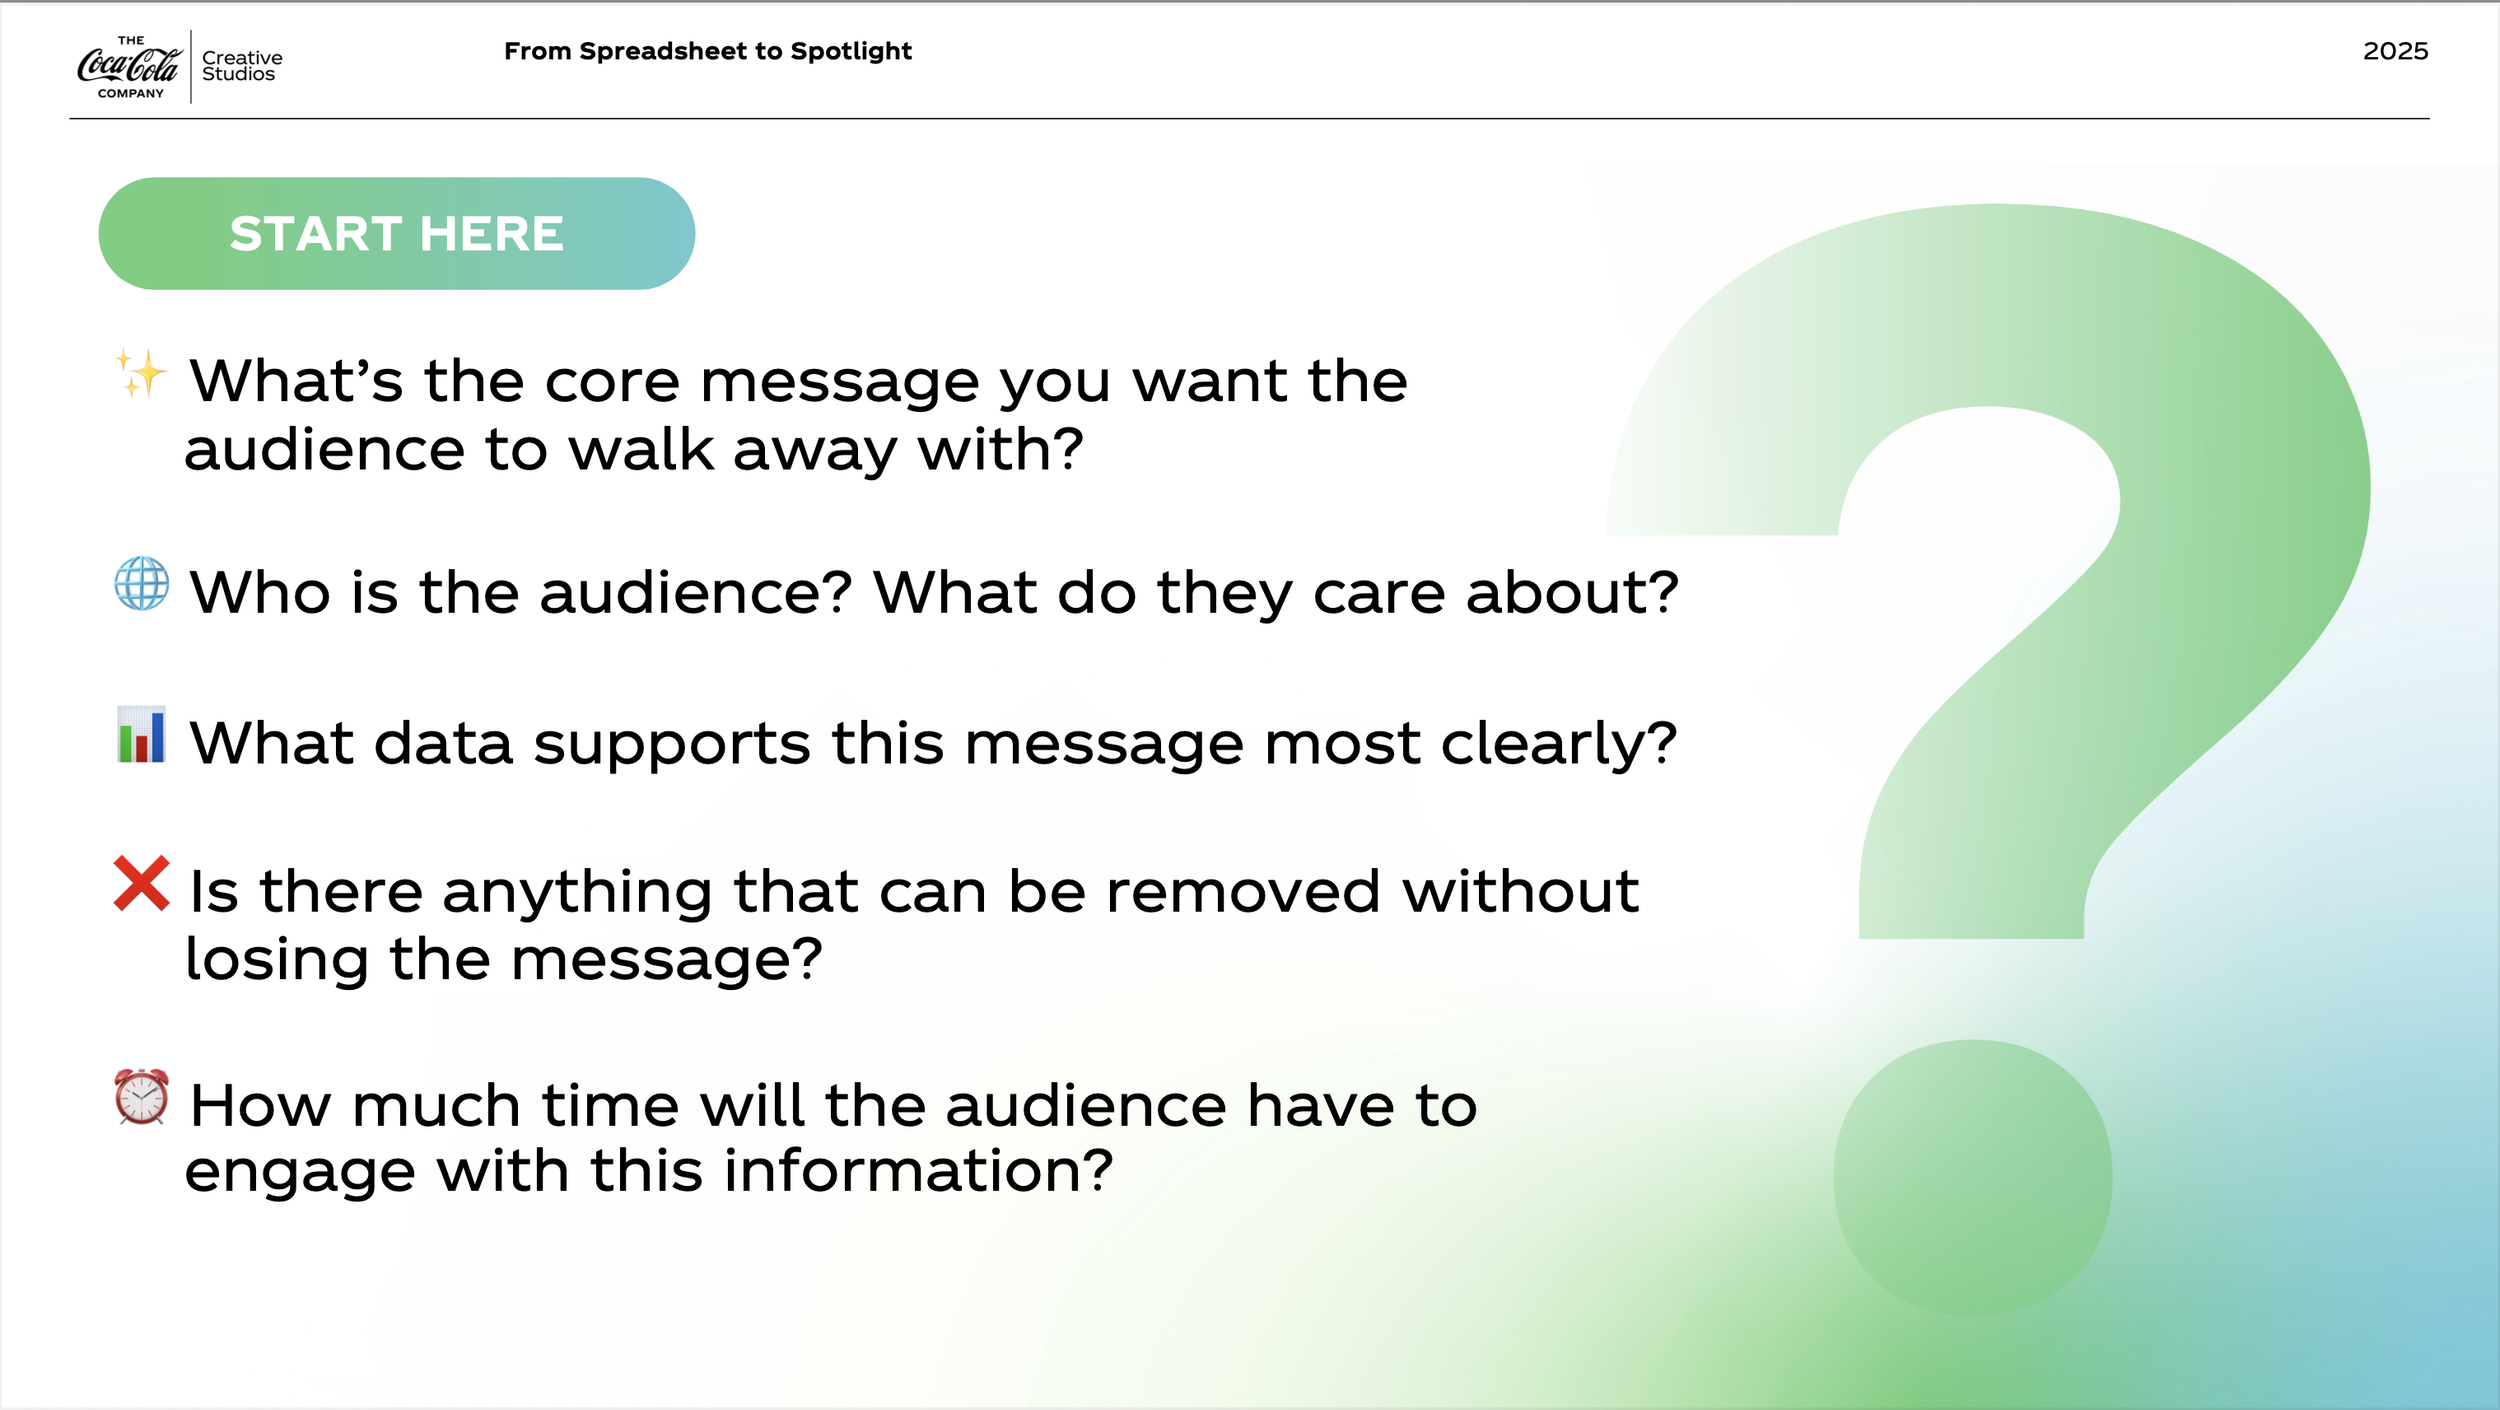
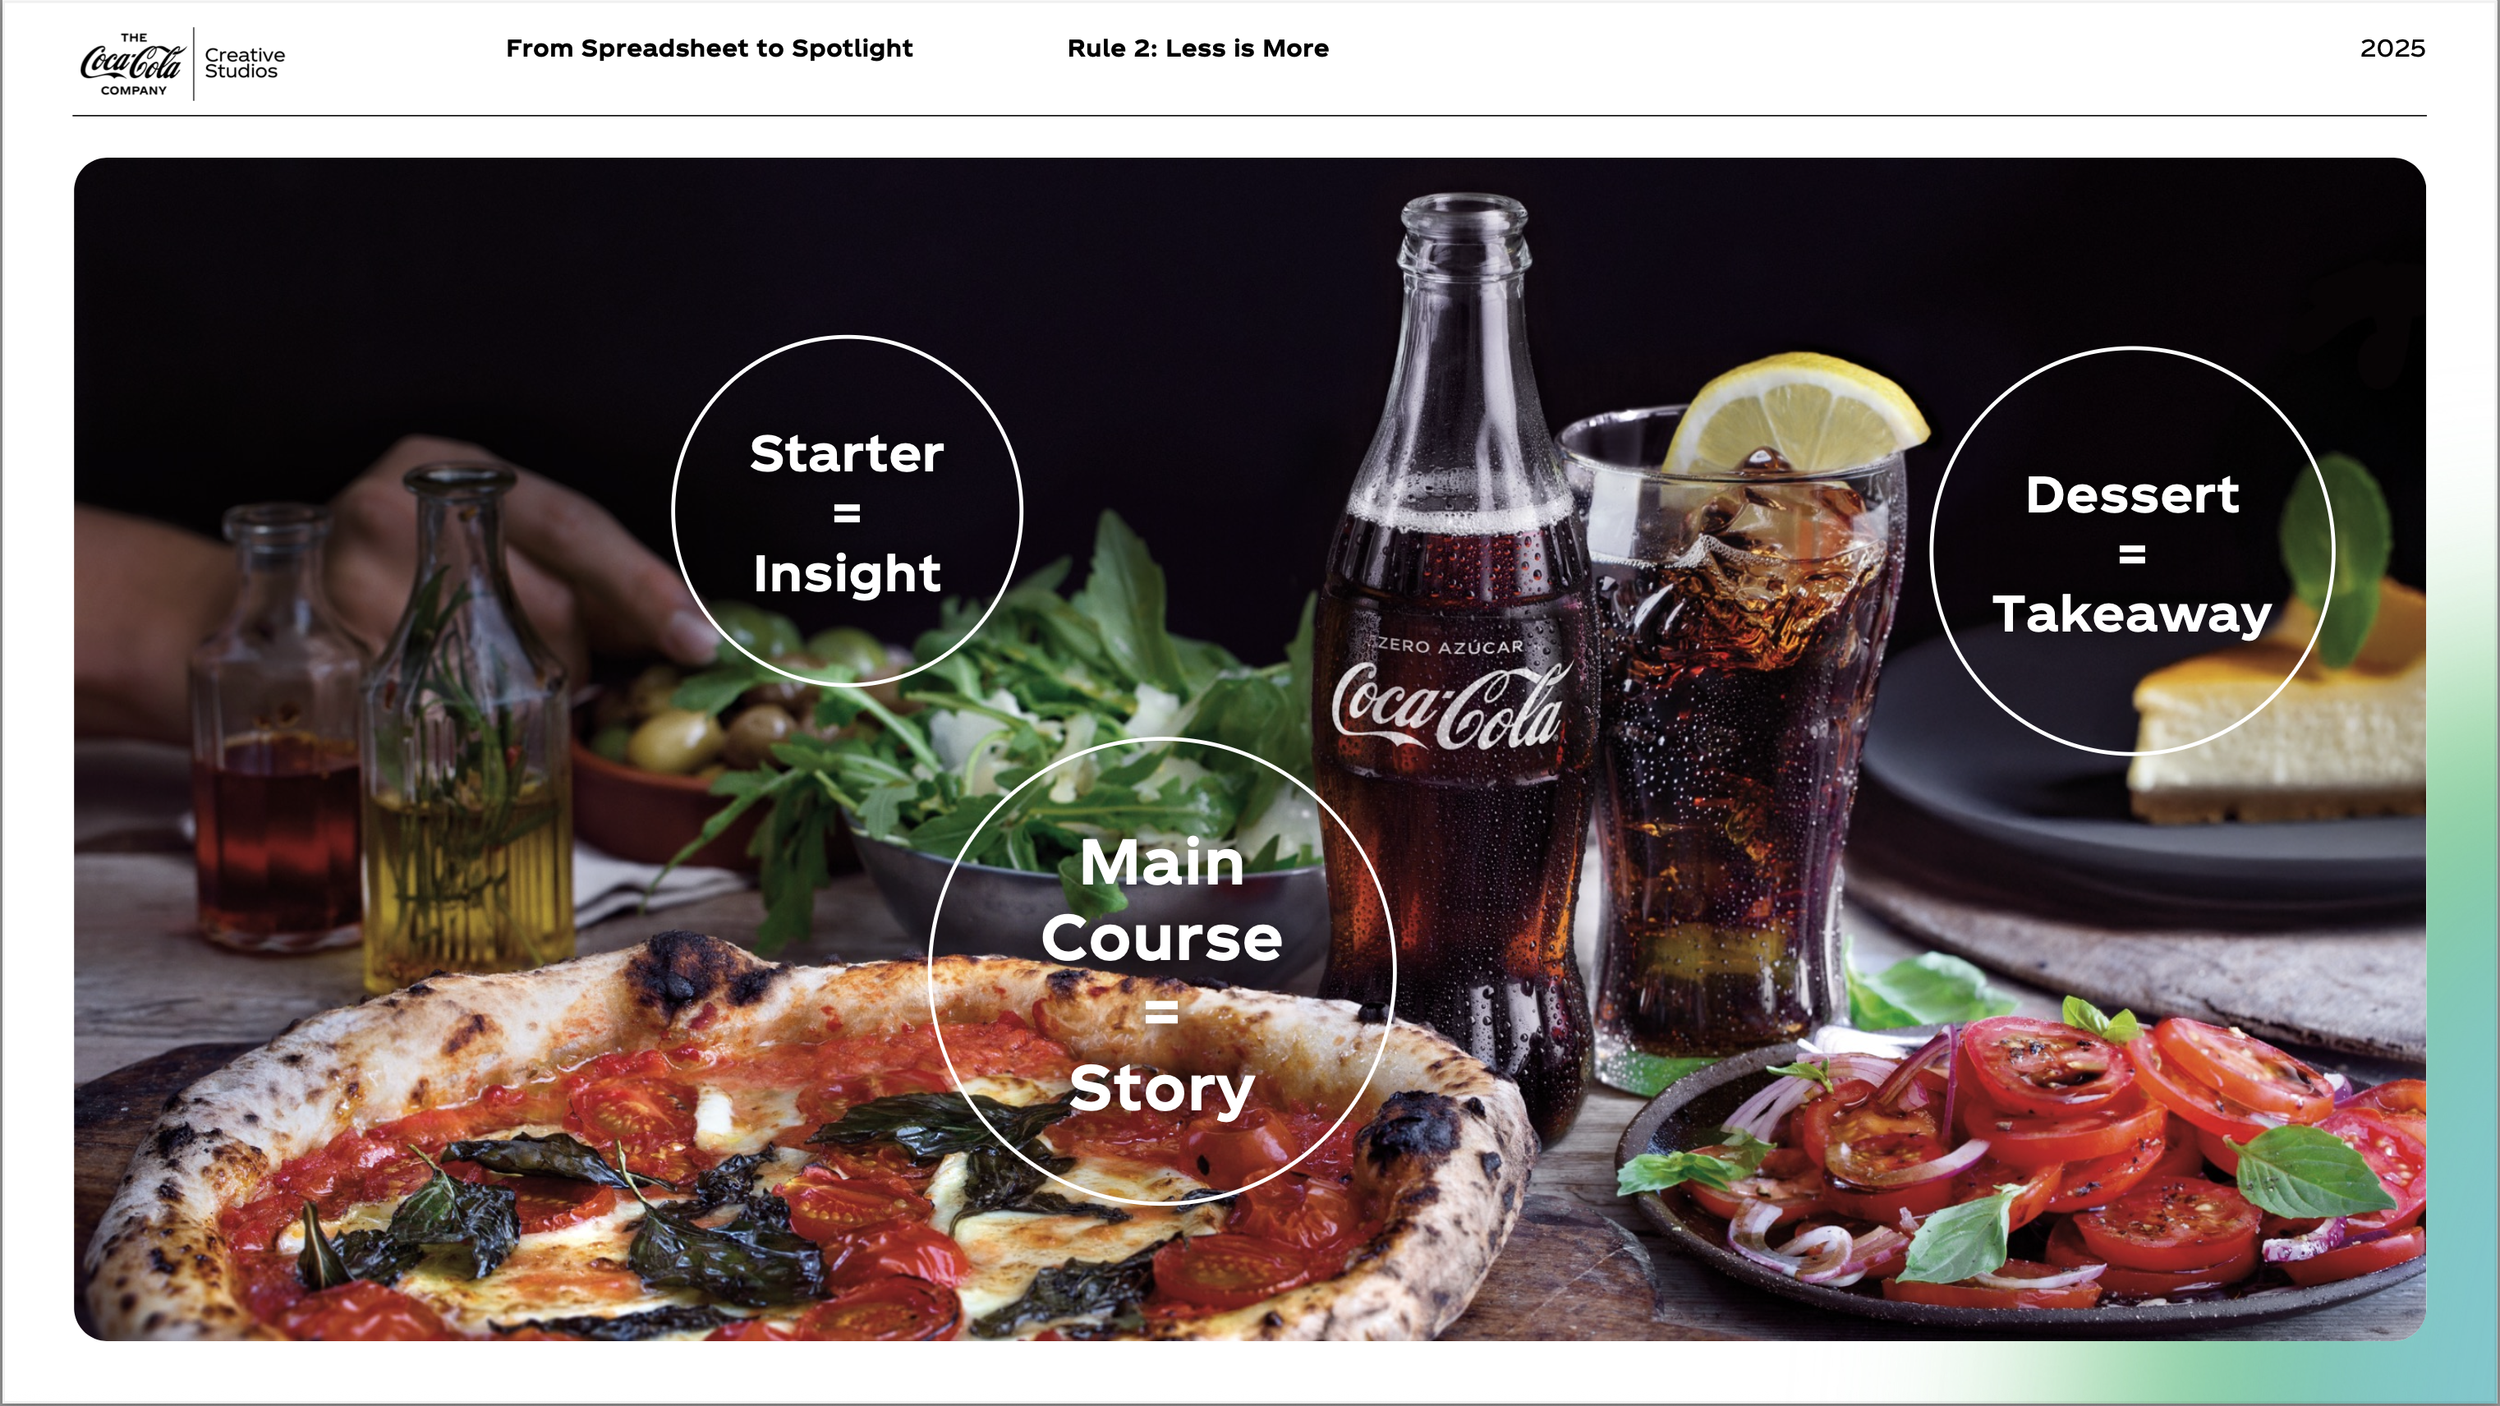
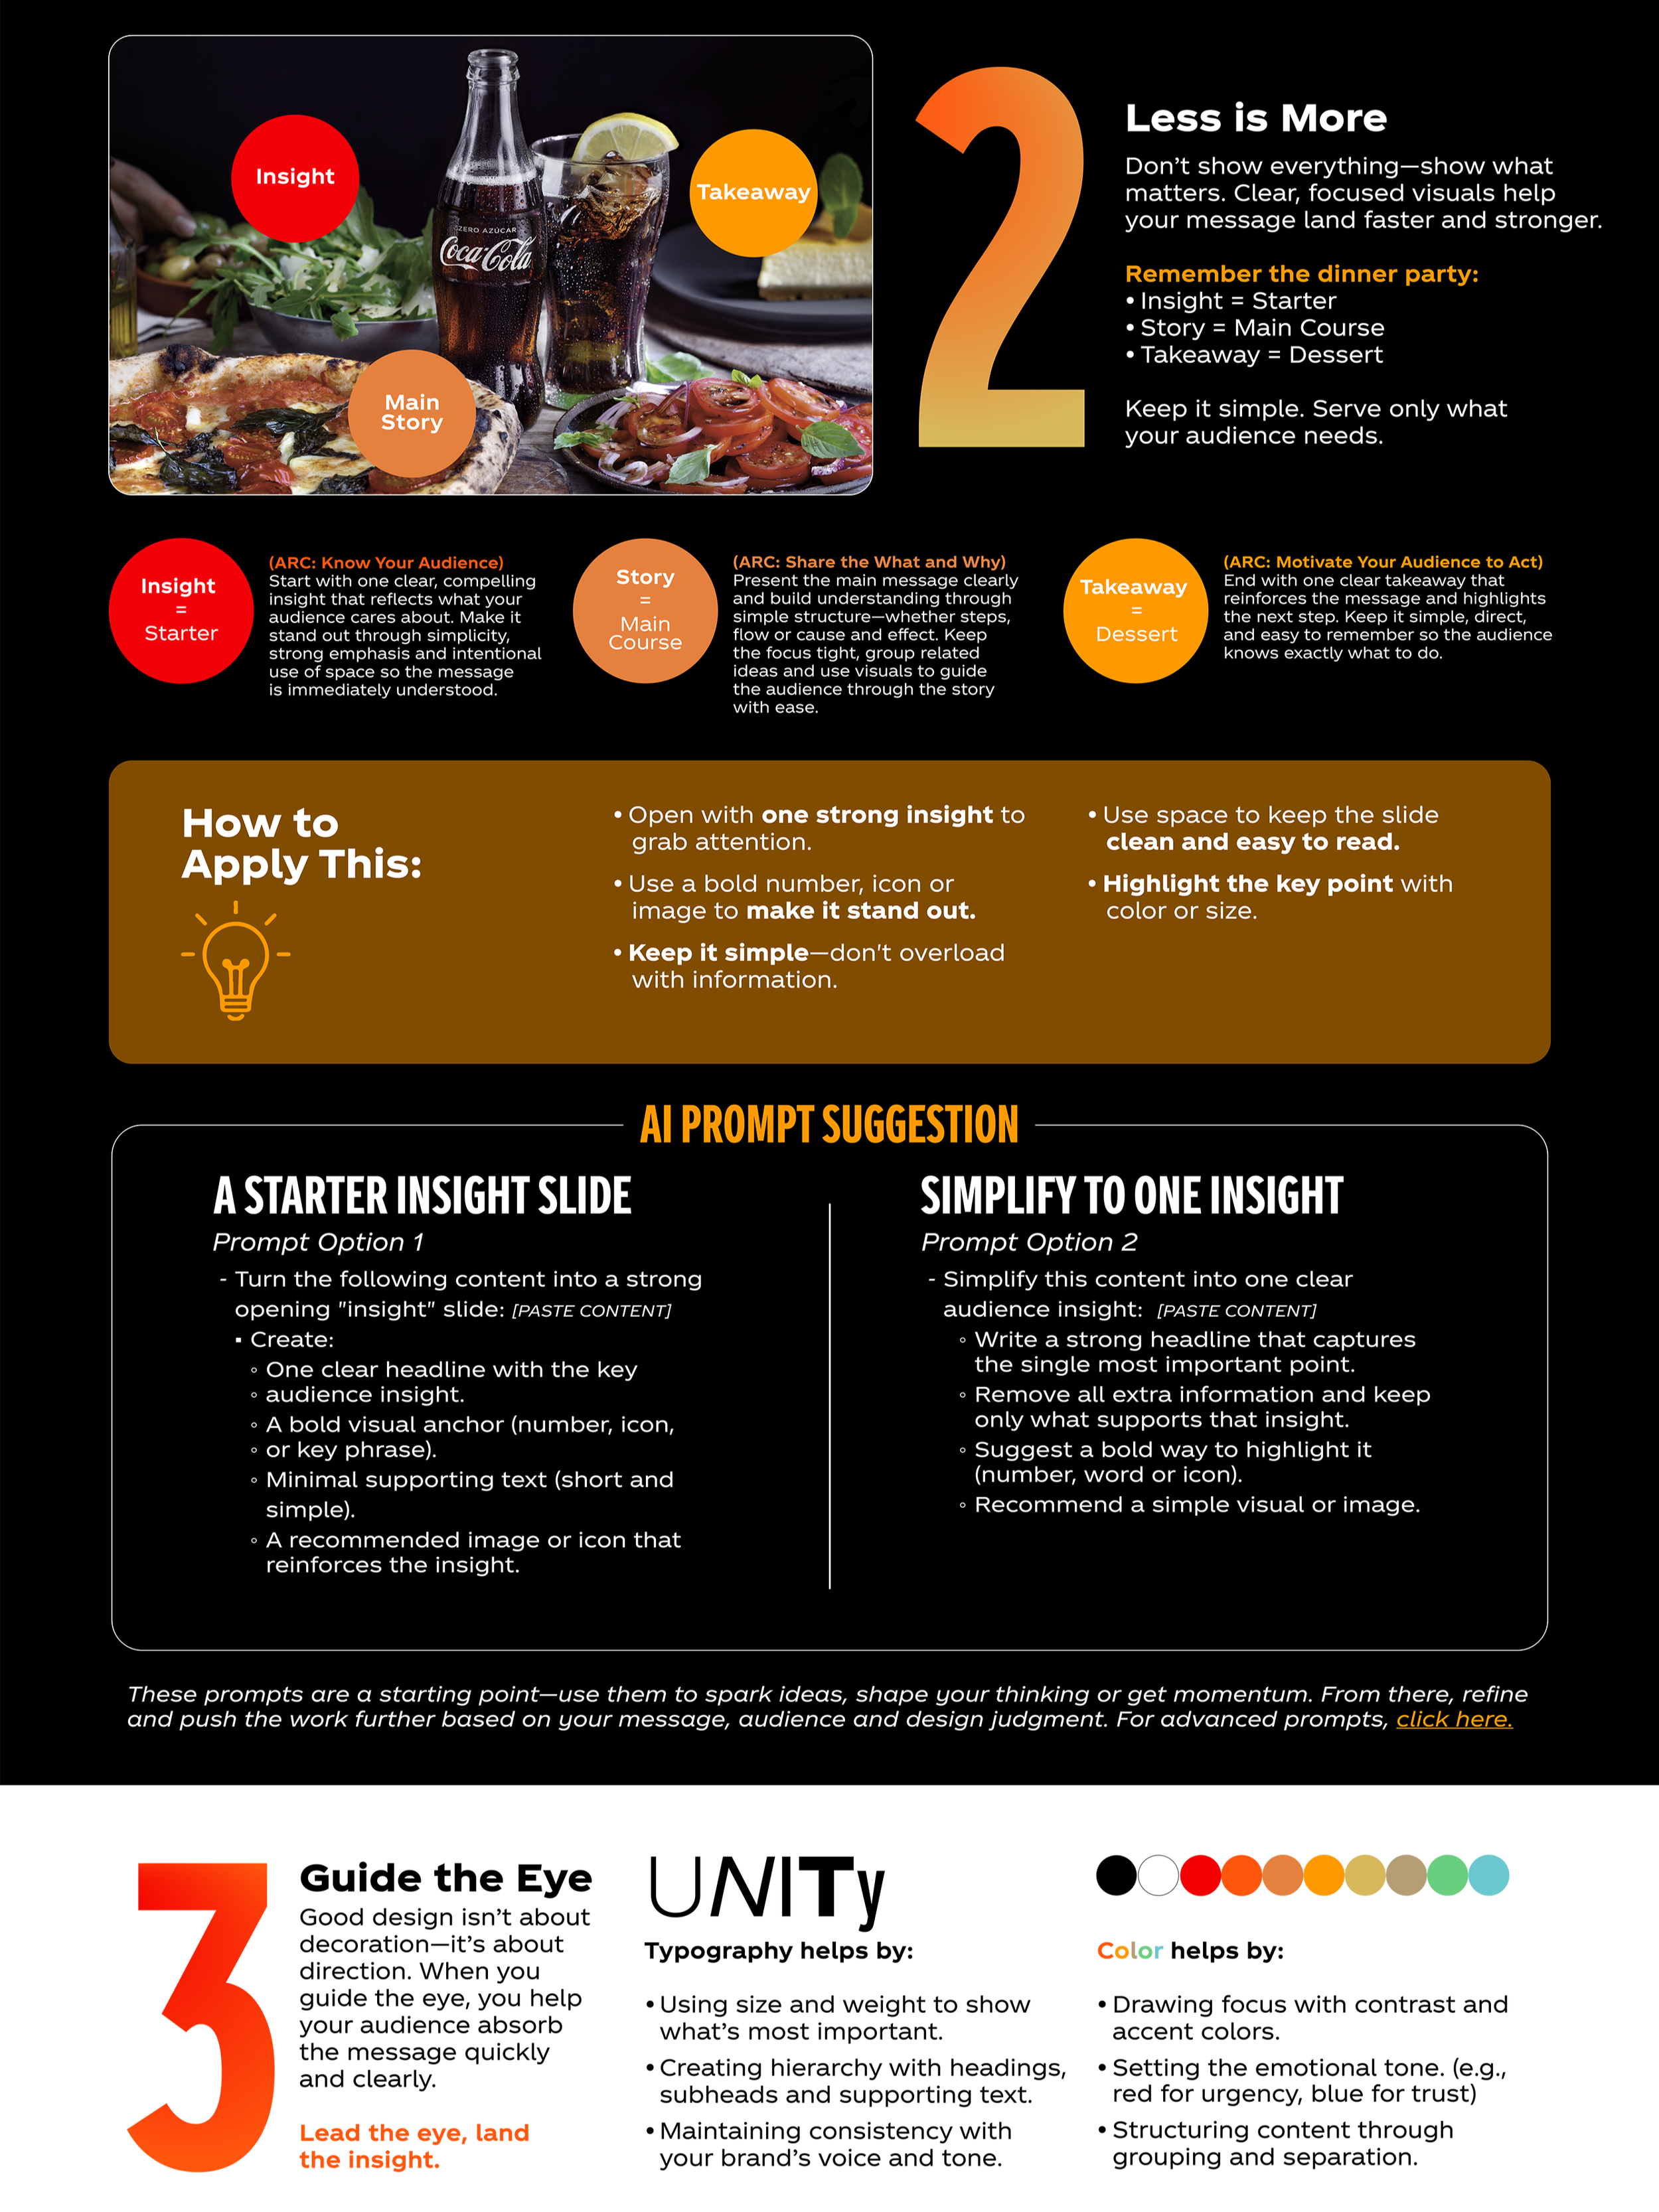
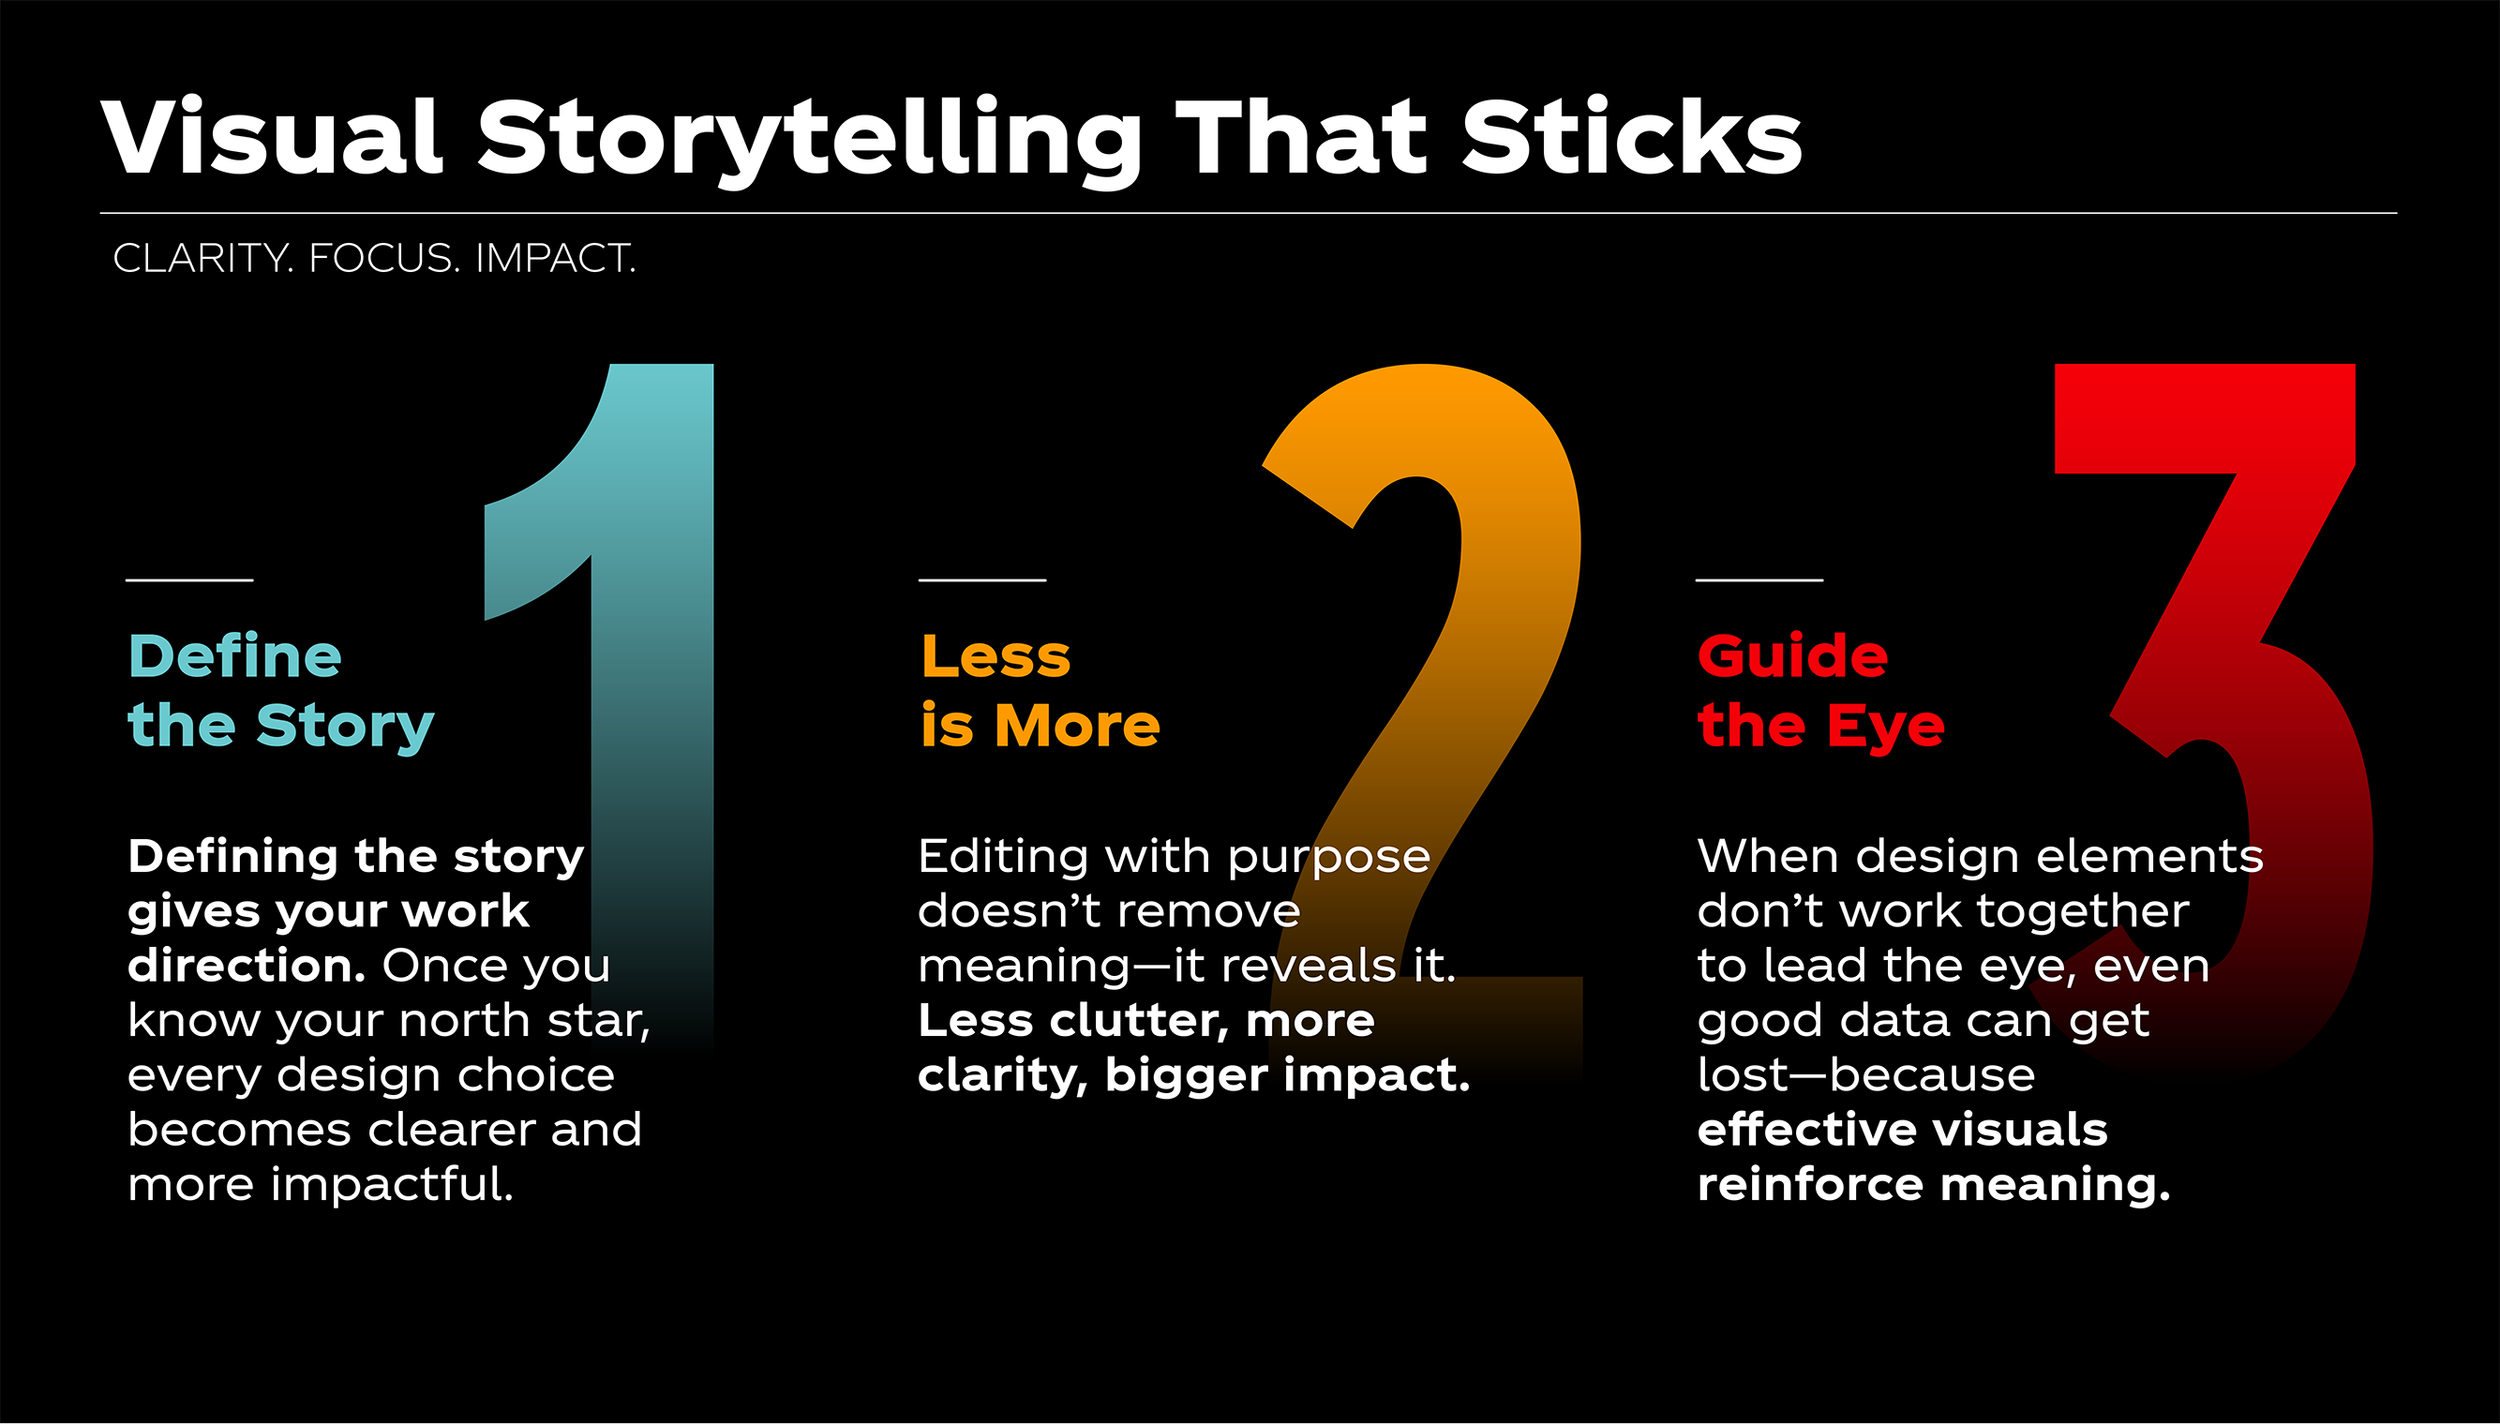
Not everyone at The Coca-Cola Company is a designer, but everyone makes presentations. This project broke down core visual storytelling principles- defining the story, editing with purpose, guiding the eye, into language built for a corporate audience, complete with AI prompt suggestions that gave non-designers a real starting point instead of a blank slide. A companion leave-behind, From Spreadsheet to Spotlight, put the rules into practice, transforming a dense quarterly results slide into a clear, visual story to show teams exactly what the shift looks like in action.
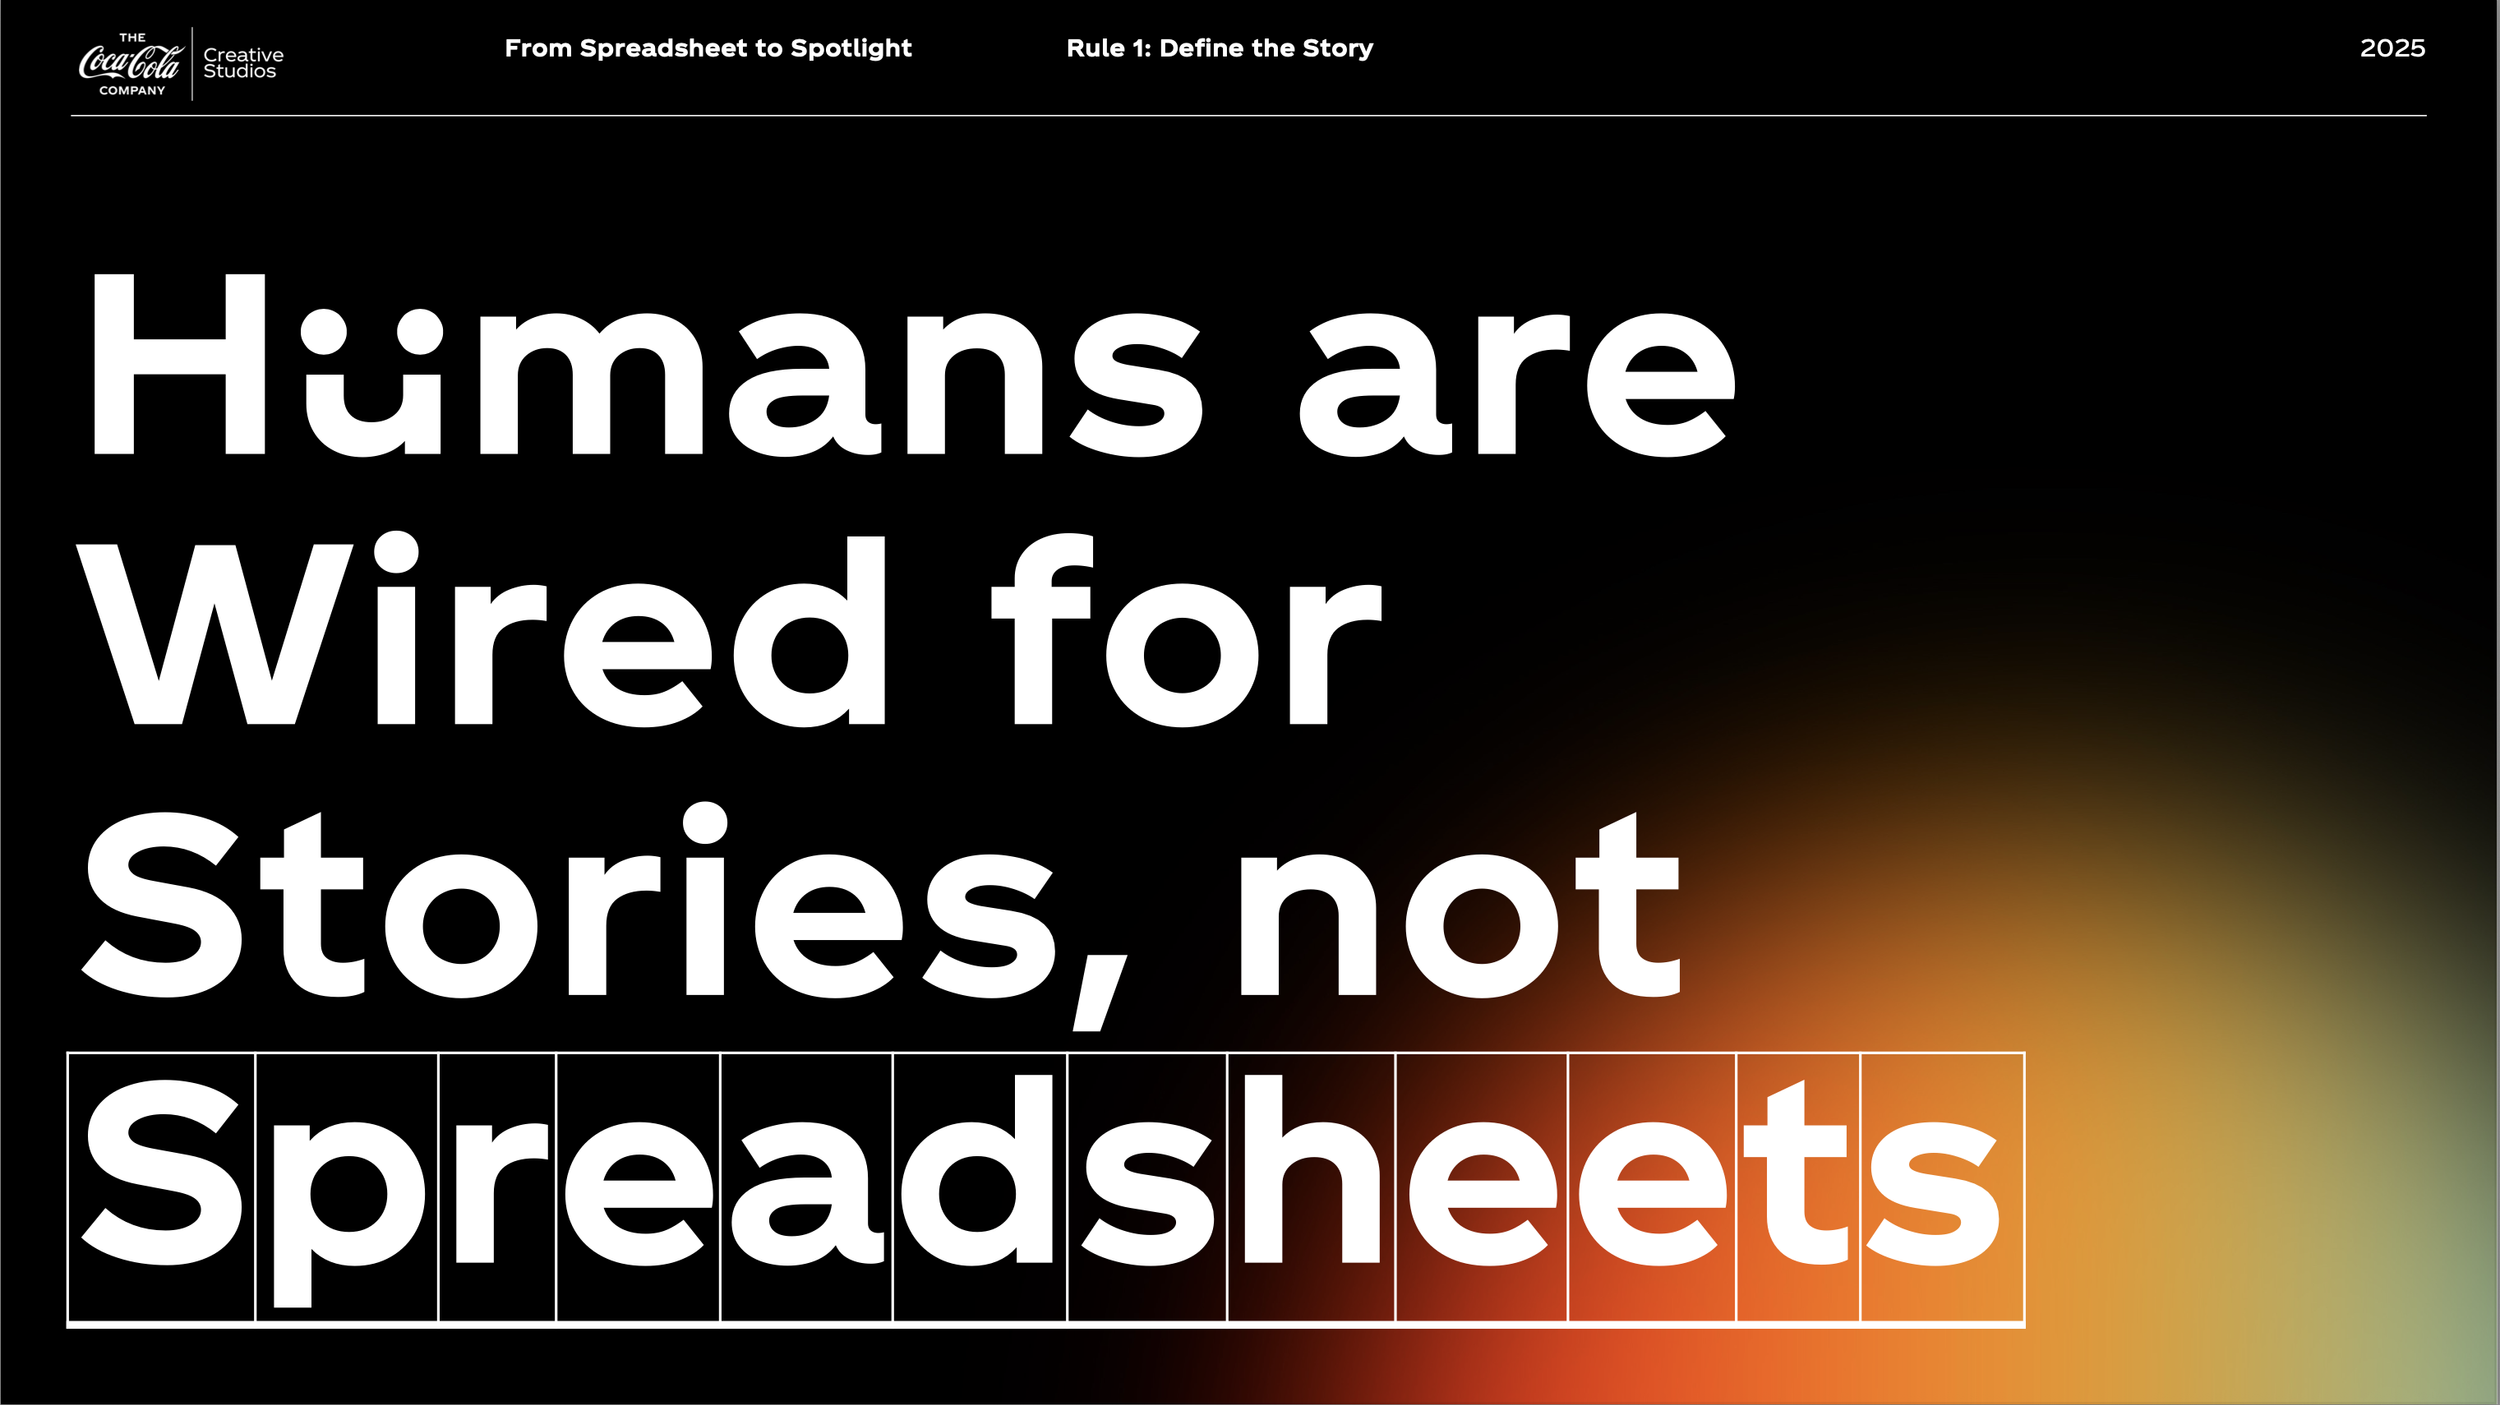
The Guide
The Leave-Behind